

QPainter: Colored matrix to paint
-
wrote on 29 Oct 2019, 17:35 last edited by
I'm learning about how to paint a widget using
QPainter(pixel per pixel) and I already saw theBasic Tools Pluginexample in the Qt Creator, but I'm a little bit confuse about how to do this simple task below:std::vector< std::vector<QColor> > colored_matrix(3, 3); // Fill the 'colored_matrix' with QColor data (RGB) // Red: colored_matrix[0][0] = QColor(256, 0, 0, 0); colored_matrix[0][1] = QColor(256, 0, 0, 0); colored_matrix[0][2] = QColor(256, 0, 0, 0); // Green: colored_matrix[1][0] = QColor(0, 256, 0, 0); colored_matrix[1][1] = QColor(0, 256, 0, 0); colored_matrix[1][2] = QColor(0, 256, 0, 0); // Blue: colored_matrix[2][0] = QColor(0, 0, 256, 0); colored_matrix[2][1] = QColor(0, 0, 256, 0); colored_matrix[2][2] = QColor(0, 0, 256, 0); // Paint this matrix in a UI widget.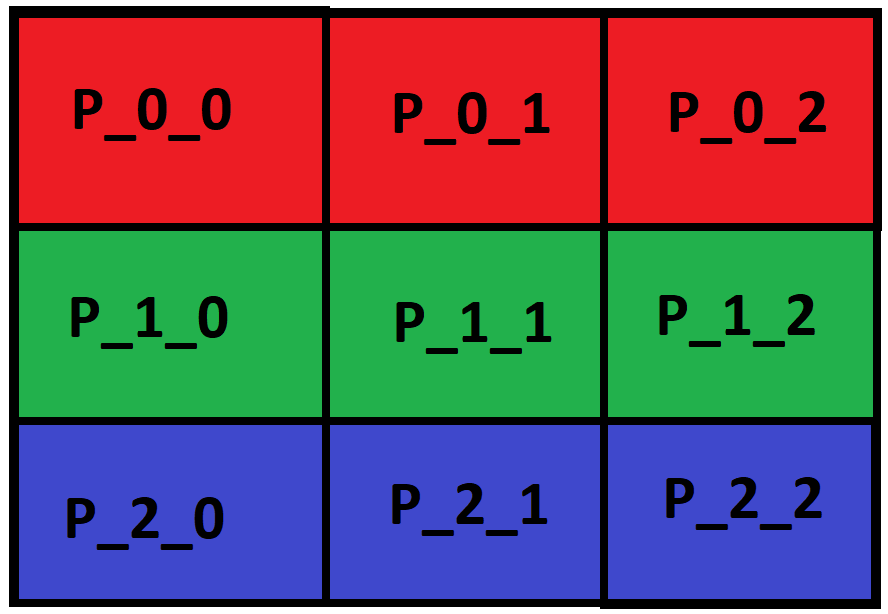
How can I get this output colored matrix UI (just the colors, without the cells names)?
-
@SGaist yes...I understand the generic algorithm, but I don't know how to paint it on UI screen.
Could you help me?
wrote on 29 Oct 2019, 19:48 last edited by@fem_dev here is the solution!
// Set the image size: int sizeX = 400; int sizeY = 400; // Create and init the image: QImage image = QImage(sizeX, sizeY, QImage::Format_RGB32); // Fill the image with colors: for (int x = 0; x < sizeX; x++) { for (int y = 0; y < sizeY; y++) { image.setPixel(x, y, qRgb(x, y, 200)); } } // Create a graphics scene: QGraphicsScene* graphic = new QGraphicsScene(this); // Set the image: graphic->addPixmap(QPixmap::fromImage(image)); // Display it on the UI: ui->graphicsView->setScene(graphic); -
Hi,
Looks like you need two for loops that will draw the rectangles and pick the color from your matrix.
Do you need any more details ?
-
Hi,
Looks like you need two for loops that will draw the rectangles and pick the color from your matrix.
Do you need any more details ?
-
@SGaist yes...I understand the generic algorithm, but I don't know how to paint it on UI screen.
Could you help me?
wrote on 29 Oct 2019, 19:48 last edited by@fem_dev here is the solution!
// Set the image size: int sizeX = 400; int sizeY = 400; // Create and init the image: QImage image = QImage(sizeX, sizeY, QImage::Format_RGB32); // Fill the image with colors: for (int x = 0; x < sizeX; x++) { for (int y = 0; y < sizeY; y++) { image.setPixel(x, y, qRgb(x, y, 200)); } } // Create a graphics scene: QGraphicsScene* graphic = new QGraphicsScene(this); // Set the image: graphic->addPixmap(QPixmap::fromImage(image)); // Display it on the UI: ui->graphicsView->setScene(graphic); -
You are over-complicating things.
If you want to use a QGraphicsScene, then use QGraphicsScene::addRect and pass the colour to the brush.
Otherwise, QImage provides a fill method.
For QPainter, you have QPainter::drawRect. Just modify the painter brush before paiting the rectangle.
-
You are over-complicating things.
If you want to use a QGraphicsScene, then use QGraphicsScene::addRect and pass the colour to the brush.
Otherwise, QImage provides a fill method.
For QPainter, you have QPainter::drawRect. Just modify the painter brush before paiting the rectangle.
wrote on 30 Oct 2019, 12:24 last edited by@SGaist thank you. For my given colored matrix above you are right!
I called this post above as a "solution" because, in the original first post, I was talking about a oversimplified view of my real problem. It was my fault!
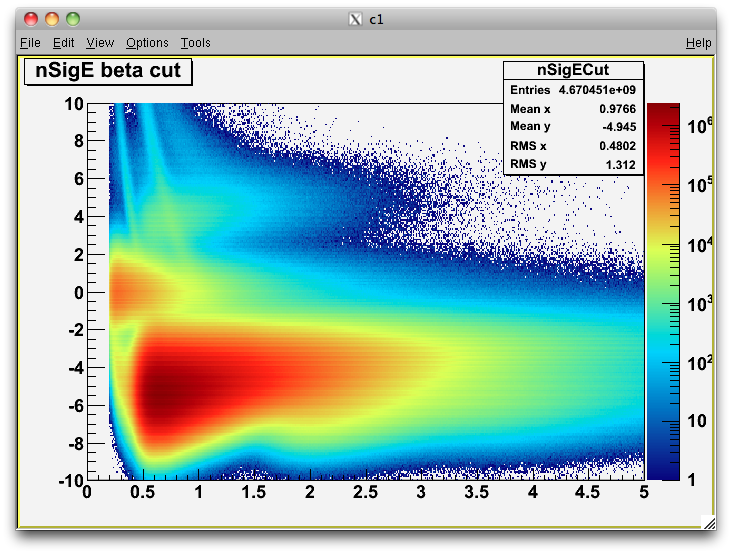
I tried to simplify the real problem a lot and I ended up changing the focus / resolution target. Sorry about that!Well, I want to develop a 2D histogram graph using Qt. So I have to set a color pixel per pixel on screen, like this example below:
Using the source-code in this post above I can set the color values pixel per pixel.
QUESTION:
Is there a better/correct way to do this?In the nexts steps I need to understand how to:
a) Create the X and Y axis (with ticks ans labels)
b) Create the right-side color pallet (with ticks ans labels)
c) Set a graph titlePlease, if you have any sugestions about how to implement these things, let me know.
Thank you again!
-
wrote on 30 Oct 2019, 13:12 last edited by
It's always nice to see ROOT plots ;-)
Would QCustomPlot fullfill your needs?
-
It's always nice to see ROOT plots ;-)
Would QCustomPlot fullfill your needs?
wrote on 31 Oct 2019, 13:07 last edited by@JohanSolo Unfortunately the QCustomPlot doesn't have the 2D histogram plot.
I tryed to use ROOT and I saw that there was a ROOT + Qt 3/4 integration in the past.
So I downloaded the binary ROOT installer for Windows 10 x64 and installed it.
After that, i tryed to run the ROOT installed executable file.
It open the Windows Console and give a error aboutmissing #include <new>and another things....and closes the console window...May be there is a another plot library that can plot a 2D histogram and is better to integrate with Qt C++ GUI application.
Do you know another library?
2/8