
Unable to debug program, on raspberry Pi 3 from QT
-
wrote on 17 Mar 2018, 20:14 last edited by
Hi,
I am having trouble debugging program on Raspberry pi 3 via gdb. I cross compile, from Ubuntu machine to raspberry.
I followed tutorials from here:
https://medium.com/@amirmann/how-to-cross-compile-qt-for-raspberry-pi-3-on-linux-ubuntu-for-beginners-75acf2a078c
and
https://fecub.wordpress.com/2018/01/15/compile-qt-for-raspberry-pi/If I try to run without debugging, program builds successfully, it deploys, I can start it on raspberry, but if I try to run and debug from qt I receive these messages:
Checking available ports...
Found 101 free ports.
Starting gdbserver...
Debugging startsListening on port 10001
Remote debugging from host 192.168.0.103
Process /home/pi/Program created; pid = 5062
Remote side has terminated connection. GDBserver will reopen the connection.
Listening on port 10001
Debugging has finishedI am using gdb multiarch on Ubuntu and gdbserver from apt-get on raspberry. Every time I try to debug, new port opens and I receive same message. What could be wrong?
-
Hi,
I am having trouble debugging program on Raspberry pi 3 via gdb. I cross compile, from Ubuntu machine to raspberry.
I followed tutorials from here:
https://medium.com/@amirmann/how-to-cross-compile-qt-for-raspberry-pi-3-on-linux-ubuntu-for-beginners-75acf2a078c
and
https://fecub.wordpress.com/2018/01/15/compile-qt-for-raspberry-pi/If I try to run without debugging, program builds successfully, it deploys, I can start it on raspberry, but if I try to run and debug from qt I receive these messages:
Checking available ports...
Found 101 free ports.
Starting gdbserver...
Debugging startsListening on port 10001
Remote debugging from host 192.168.0.103
Process /home/pi/Program created; pid = 5062
Remote side has terminated connection. GDBserver will reopen the connection.
Listening on port 10001
Debugging has finishedI am using gdb multiarch on Ubuntu and gdbserver from apt-get on raspberry. Every time I try to debug, new port opens and I receive same message. What could be wrong?
Hi @linuxTown
can you please post the contents of Window > Views > Debugger Log? It may contain more information to isolate the problem.
Regards
-
Hi @linuxTown
can you please post the contents of Window > Views > Debugger Log? It may contain more information to isolate the problem.
Regards
wrote on 17 Mar 2018, 21:29 last edited byHi, @aha_1980
I pasted output here:
https://pastebin.com/Lt3kjMTMOne of the lines says, that executable was not found, but there is, I can see it and run it on my pi.
-
Hi, @aha_1980
I pasted output here:
https://pastebin.com/Lt3kjMTMOne of the lines says, that executable was not found, but there is, I can see it and run it on my pi.
I don't see any obvious, except the "path not found" errors.
Can you check that the path to your executable does not contain spaces or other special characters?
-
I don't see any obvious, except the "path not found" errors.
Can you check that the path to your executable does not contain spaces or other special characters?
wrote on 18 Mar 2018, 07:09 last edited byThere aren't any special characters in path, and no spaces...
I am just a begginer, so it's hard to know whats wrong.
And what about these lines? Are they related to file not being found?
//---------------------
...~"/build/gdb-9un5Xp/gdb-7.11.1/gdb/thread.c:982: internal-error: is_thread_state: Assertion
tp' failed.\nA problem internal to GDB has been detected,\nfurther debugging may prove unreliable.\nQuit this debugging session? " ~"(y or n) [answered Y; input not from terminal]\n" &"\nThis is a bug, please report it." &" For instructions, see:\n<http://www.gnu.org/software/gdb/bugs/>." &"\n\n" ~"/build/gdb-9un5Xp/gdb-7.11.1/gdb/thread.c:982: internal-error: is_thread_state: Assertiontp' failed.\nA problem internal to GDB has been detected,\nfurther debugging may prove unreliable.\nCreate a core file of GDB? "
dQUIT DEBUGGER REQUESTED IN STATE 19
~"(y or n) [answered Y; input not from terminal]\n"dHANDLE GDB ERROR: The process was ended forcefully.
dProcess crashed
....
//------------------------------------ -
There aren't any special characters in path, and no spaces...
I am just a begginer, so it's hard to know whats wrong.
And what about these lines? Are they related to file not being found?
//---------------------
...~"/build/gdb-9un5Xp/gdb-7.11.1/gdb/thread.c:982: internal-error: is_thread_state: Assertion
tp' failed.\nA problem internal to GDB has been detected,\nfurther debugging may prove unreliable.\nQuit this debugging session? " ~"(y or n) [answered Y; input not from terminal]\n" &"\nThis is a bug, please report it." &" For instructions, see:\n<http://www.gnu.org/software/gdb/bugs/>." &"\n\n" ~"/build/gdb-9un5Xp/gdb-7.11.1/gdb/thread.c:982: internal-error: is_thread_state: Assertiontp' failed.\nA problem internal to GDB has been detected,\nfurther debugging may prove unreliable.\nCreate a core file of GDB? "
dQUIT DEBUGGER REQUESTED IN STATE 19
~"(y or n) [answered Y; input not from terminal]\n"dHANDLE GDB ERROR: The process was ended forcefully.
dProcess crashed
....
//------------------------------------@linuxTown the lines may be related to your problem, but let's check first the project path on your host PC also. does the program has the same name there?
-
@linuxTown the lines may be related to your problem, but let's check first the project path on your host PC also. does the program has the same name there?
wrote on 18 Mar 2018, 07:52 last edited byI just recreated project, from scratch, now I can go a bit further. Program has same name on host and raspberry. The path to project is a bit diferent, its in:
/home/tt/build-Project-Raspberry_pi-Debug/ProgramNow if I try to debug, I receive this message:
and here is the log:
https://pastebin.com/dtZFcgBc -
I just recreated project, from scratch, now I can go a bit further. Program has same name on host and raspberry. The path to project is a bit diferent, its in:
/home/tt/build-Project-Raspberry_pi-Debug/ProgramNow if I try to debug, I receive this message:
and here is the log:
https://pastebin.com/dtZFcgBc@linuxTown yeah, looks better. could you try a non-GUI aka console program first ?
-
@linuxTown yeah, looks better. could you try a non-GUI aka console program first ?
wrote on 18 Mar 2018, 13:34 last edited byThank you for helping, I just found in this tutorial comments solution:
https://www.baldengineer.com/raspberry-pi-gui-tutorial.htmlIt appears, I was missing $DISPLAY variable.
I just did these steps:
– sudo nano ~/.profile
– I added the following line to the end: export DISPLAY=:0
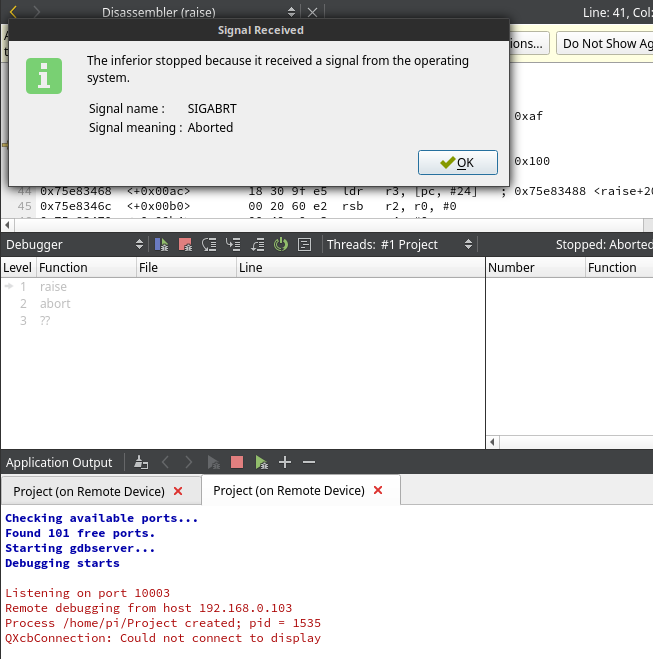
– Reboot: sudo reboot <–This is a must!!!!!Now I am able to run with debugger. But now, when I add breakpoint in code I once again get new error :/
Listening on port 10001
Remote debugging from host 192.168.0.103
Process /home/pi/Project created; pid = 967
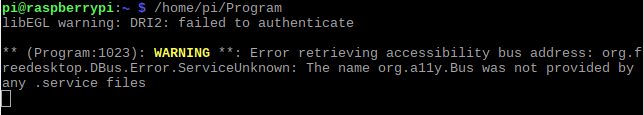
libEGL warning: DRI2: failed to authenticate
Could not load shared library symbols for /usr/lib/arm-linux-gnueabihf/libtxc_dxtn.so.
Do you need "set solib-search-path" or "set sysroot"?If I can't find solution, then I will try console program.
-
@linuxTown yeah, looks better. could you try a non-GUI aka console program first ?
wrote on 18 Mar 2018, 14:30 last edited byI just used code form this website and now I can run program and debug it, finally :)
https://catonrug.blogspot.lt/2018/01/libegl-warning-dri2-failed-authenticate.html
-
I just used code form this website and now I can run program and debug it, finally :)
https://catonrug.blogspot.lt/2018/01/libegl-warning-dri2-failed-authenticate.html
@linuxTown: Cool - Thanks for your feedback.
So please mark this thread as solved now.
1/11