Skip to content
  • Categories
  • Recent
  • Tags
  • Popular
  • Users
  • Groups
  • Search
  • Get Qt Extensions
  • Unsolved
Collapse
Brand Logo
  1. Home
  2. Qt Development
  3. QML and Qt Quick
  4. ChartView buggy when specifying `plotArea`
Forum Updated to NodeBB v4.3 + New Features

ChartView buggy when specifying `plotArea`

Scheduled Pinned Locked Moved Unsolved QML and Qt Quick
1 Posts 1 Posters 124 Views
  • Oldest to Newest
  • Newest to Oldest
  • Most Votes
Reply
  • Reply as topic
Log in to reply
This topic has been deleted. Only users with topic management privileges can see it.
  • D Offline
    D Offline
    Developer123
    wrote on last edited by Developer123
    #1

    ChartView is very buggy by nature, but when you speficy plotArea attribute the buggyness gets over the charts.

    Exemple code:

    import QtQuick 2.15
    import QtCharts 2.15
    import QtGraphicalEffects 1.15
    import QtQuick.Controls 2.15
    
    Rectangle {
        width: 500
        height: 300
        ChartView{
          id: chart_component
          anchors.fill: parent
          backgroundColor: "#000044"
    
          plotArea: Qt.rect(40, 40, chart_component.width-60, chart_component.height-60)
    
          // X Axis
          ValueAxis {
              id: valueAxisX
              titleVisible: false
              visible : true
              min: 0
              max: 10
              tickCount: 10
              labelFormat: "%.2f"
          }
    
          // Y Axis
          ValueAxis {
              id: valueAxisY
              min: 0.0
              max: 10.0
              tickCount: 5
              labelFormat: "%.2f"
          }
          LineSeries {
              id: defaultSeries
              name: "default"
              color: "green"
              axisX: valueAxisX
              axisY: valueAxisY
    
              XYPoint { x: 0; y: 0 }
              XYPoint { x: 1.1; y: 2.1 }
              XYPoint { x: 1.9; y: 3.3 }
              XYPoint { x: 2.1; y: 2.1 }
              XYPoint { x: 2.9; y: 4.9 }
              XYPoint { x: 3.4; y: 3.0 }
              XYPoint { x: 4.1; y: 3.3 }
          }
    
          Button {
              id: button
              x: 382
              y: 18
              text: qsTr("ZOOM")
              onClicked: {
                  chart_component.zoomIn()
              }
          }
    
    
     }
    }
    
    /*##^##
    Designer {
        D{i:0;formeditorZoom:2}D{i:2}D{i:3}D{i:4}D{i:12}D{i:1}
    }
    ##^##*/


    As you can see, the backgroundColor: "#000044" is not being rendered, instead it shows the background from the Rectangle, which is white:

    a4cf2ca6-6695-4473-b79f-465fe413a1f2-image.png

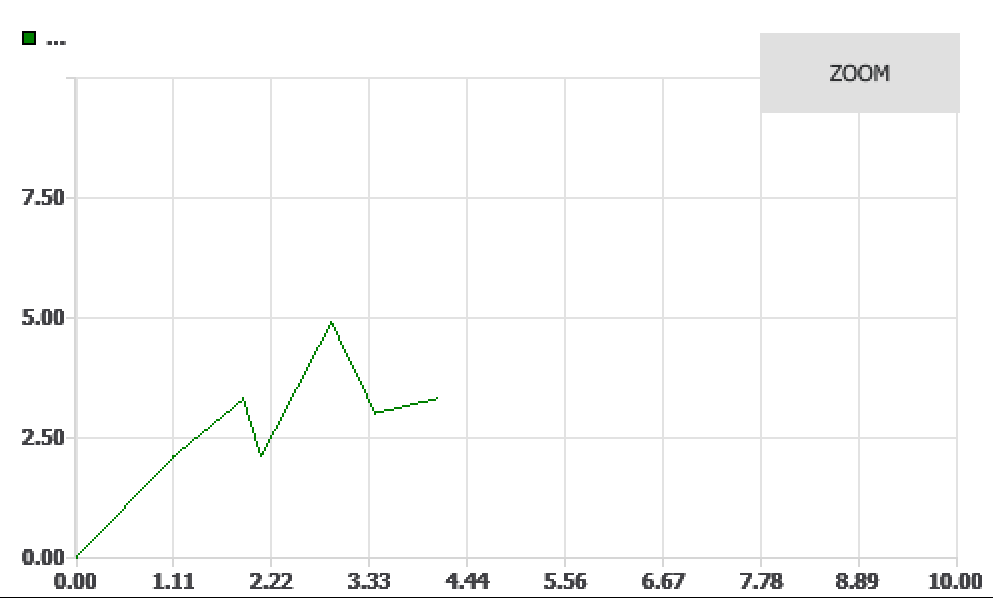
    As a side effect, on every re-render, the last frame is not earased. In this case, if I zoom into the Graph by clicking on the button, everything gets blended:

    32439267-5430-4b45-a5a6-915919329f0c-image.png

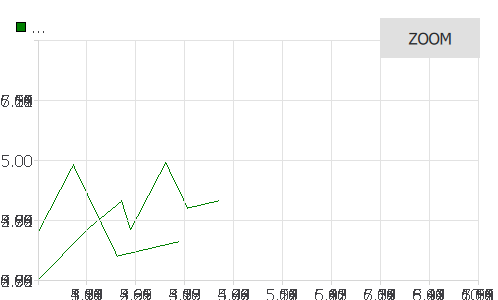
    Any ideas how to solve this?

    1 Reply Last reply
    0

    • Login

    • Login or register to search.
    • First post
      Last post
    0
    • Categories
    • Recent
    • Tags
    • Popular
    • Users
    • Groups
    • Search
    • Get Qt Extensions
    • Unsolved