

ViewBox, AxisItem and PlotItem (from GraphicsWidget) do not adapt their size to the new screen
-
I am using palms (https://github.com/PALMS-gui/PALMS) to plot a signal in python. This program has a class named plot_area.py in which they define the things they use to plot. I think the important ones are a ViewBox, AxisItem and PlotItem (all inherite from GraphicsWidget). The program in principle works well, you can see the plot with the axis and a grid with the proper values.
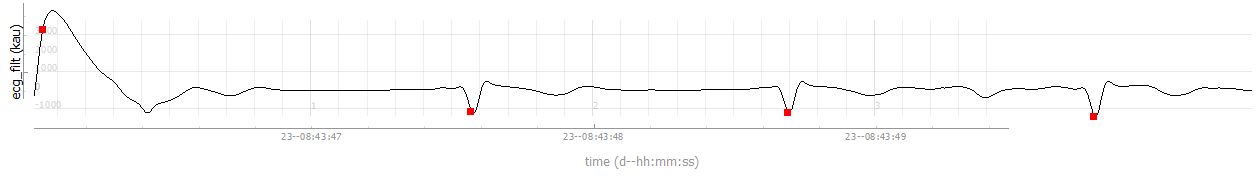 ! The problem is that if I run the program on a different screen (in my case, I have the laptop connected to a second screen), the grid and the axis keep the original size. We can see that on the first image. The plot seems fine and takes all the new space, but the axis and grid are reduced. After scrolling a bit the signal, the grid gets smaller and eventually disappears.

I've been trying to fix this but I feel I haven't done any progress and I have no clue where the problem is originating. I would really appreciate some ideas on where the problem might be or any similar experiences. Thank you so much! -
Hi and welcome to devnet,
I would start by updating the PyQt and Qt versions used.
-
@SGaist Thank you for your answer. Sadly, this didn't work. I updated everything to the last version available and I have the same issue
-
@SGaist Thank you for your answer. Sadly, this didn't work. I updated everything to the last version available and I have the same issue
@guillermollopis these charts and class names rang a bell for me. I looked into
requirements.txtof the project and see it usespyqtgraphand I think charts are created with help of this library.
So I would propose you to look into pyqtgraph manuals and especially into examples (you may find how to run them here).
I think it may give you hints of how to address your problem. Maybe you will have more preciese questions (some guys here and on stackoverflow may answer it with regards to pyqtgraph usage...)