
How to reset the time on x-axis of a graph?
-
Hello All,
I have two push buttons (Start time and Reset) and a widget (promoted to QCustomPlot) in my form.ui. The graph has time displayed on x-axis and it keeps on sliding towards left like real time data plot. When I press start time button, the value of x-axis sets to 0 and moves continuously based on the time elapsed. When I push the reset button the graph starts again from zero and x-axis keeps on sliding based on the time elapsed. When I press both the buttons for the first time it works good that is it starts the x-axis from zero. Till here it works good.
After pressing the buttons for the first time, when I try for the second time none of the button sets the value on x-axis to zero and the graph keeps on displaying the time elapsed since the button is pressed for the first time. Below is my code, please guide me on this.My source code:
 void Form::on_pushButtonStartTime_clicked()
{
    connect(&dataTimer, SIGNAL(timeout()), this, SLOT(realtimeDataSlot())); // QTimer dataTimer declared in header file
    dataTimer.start(0);
}

void Form::on_pushButtonReset_clicked()
{
    connect(&dataTimer, SIGNAL(timeout()), this, SLOT(resetTime()));
    dataTimer.start(0);

}

void Form::realtimeDataSlot()
{
    static QTime time(QTime::currentTime());
    double key = time.elapsed()/1000.0; // time elapsed since start in seconds
    //  x-axis range scroll with the data
    ui->customPlot->xAxis->setRange(key, 6, Qt::AlignRight);
    ui->customPlot->replot();
}

void Form::resetTime()
{
    static QTime time(QTime::currentTime());
    double key=time.elapsed()/1000.0;

    ui->customPlot->xAxis->setRange(key, 6, Qt::AlignRight);
    ui->customPlot->replot();
}
Can anyone please guide me on why the above code works only for the first time and not for the consecutive pressing of the buttons.
Thank you for your time and knowledge.
-
Take a look at http://doc.qt.io/qt-5/qelapsedtimer.html
-
Take a look at http://doc.qt.io/qt-5/qelapsedtimer.html
-
@VRonin I have the same problem, I'm trying to use QElapsedTimer with QChart, can you help me to do that please. This is my code :
classe.cpp
void MaClasse::updateChart(){ ElapsedTimer .start(); //global variable chart_1->chart()->axes(Qt::Horizontal).back()->setMin(ElapsedTimer .elapsed()); chart_1->chart()->axes(Qt::Horizontal).back()->setMax(ElapsedTimer .elapsed()+10); chart_1->series()[0].serie->replace(buffer_0); QApplication::processEvents(); } -
@halima said in How to reset the time on x-axis of a graph?:
My code note working
That's clear.
What EXACTLY is not working? -
@halima said in How to reset the time on x-axis of a graph?:
My code note working
That's clear.
What EXACTLY is not working?@jsulm The max of XAxis is always 09:33:18 it's not moving when a new Data added.
This is my current code : (this function is called with a Timer every 200ms)QVector<QPointF> m_buffer = chart_1->series()[0].serie->pointsVector();//currentSerie.serie->pointsVector() ; if(m_buffer.length() > 2000){ m_buffer.remove(0); } ElapsedTimer .start(); //global variable chart_1->chart()->axes(Qt::Horizontal).back()->setMin(ElapsedTimer .elapsed()); chart_1->chart()->axes(Qt::Horizontal).back()->setMax(ElapsedTimer .elapsed()+10); m_buffer.append(QPointF(QDateTime::currentDateTime().toMSecsSinceEpoch(), qrand() % ((10 + 1) - 1) + 1)); chart_1->series()[0].serie->replace(m_buffer); QApplication::processEvents();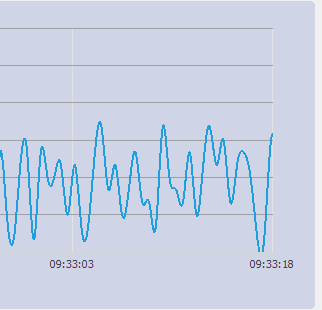
-
@VRonin I have the same problem, I'm trying to use QElapsedTimer with QChart, can you help me to do that please. This is my code :
classe.cpp
void MaClasse::updateChart(){ ElapsedTimer .start(); //global variable chart_1->chart()->axes(Qt::Horizontal).back()->setMin(ElapsedTimer .elapsed()); chart_1->chart()->axes(Qt::Horizontal).back()->setMax(ElapsedTimer .elapsed()+10); chart_1->series()[0].serie->replace(buffer_0); QApplication::processEvents(); }@halima said in How to reset the time on x-axis of a graph?:
void MaClasse::updateChart(){
ElapsedTimer .start();Why do you start the timer here?!
-
I'm using two timers :
//first timer to execute slot
QTimer *timer
 connect(timer,&QTimer::timeout,this,&CL_SubWin_Chart::updateChart);
timer->start(200);
//second timer to update XAxis
void MaClasse::updateChart(){
 QElapsedTimer ElapsedTimer;
ElapsedTimer .start();

chart_1->chart()->axes(Qt::Horizontal).back()->setMin(ElapsedTimer .elapsed());
chart_1->chart()->axes(Qt::Horizontal).back()->setMax(ElapsedTimer .elapsed()+10);
...
}
But the xAxis not move!
@halima But why do you need this ElapsedTimer which you start inside updateChart()?
You will always get more or less same value from elapsed() I think. -
@halima But why do you need this ElapsedTimer which you start inside updateChart()?
You will always get more or less same value from elapsed() I think. -
@jsulm you're right it works without this timer but I do this to update xAxis values because I need to have a real time ploting .
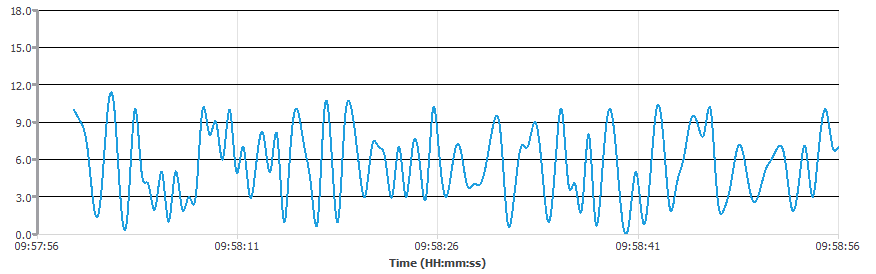
The chart serie start like this :
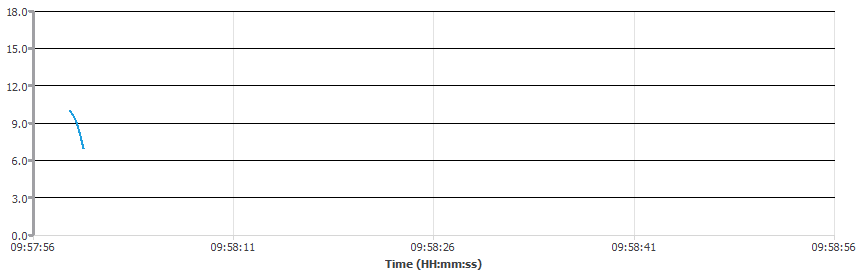
The final Chart, New Data after09:58:56 is not displayed!
@halima I suggest to move
QElapsedTimer ElapsedTimer;to your MaClasse (as member variable)
And this to the constructor:ElapsedTimer .start();then it should work.
-
@halima I suggest to move
QElapsedTimer ElapsedTimer;to your MaClasse (as member variable)
And this to the constructor:ElapsedTimer .start();then it should work.
@jsulm i did this and it's still not working :(
//constructor MaClasse::MaClasse(){ ElapsedTimer .start(); } //slot void void MaClasse::updateChart(){ QVector<QPointF> m_buffer = chart_1->series()[0].serie->pointsVector(); if(m_buffer.length() > 2000){ m_buffer.remove(0); } chart_1->chart()->axes(Qt::Horizontal).back()->setMin(ElapsedTimer .elapsed()); chart_1->chart()->axes(Qt::Horizontal).back()->setMax(ElapsedTimer .elapsed()+10); m_buffer.append(QPointF(QDateTime::currentDateTime().toMSecsSinceEpoch(), qrand() % ((10 + 1) - 1) + 1)); chart_1->series()[0].serie->replace(m_buffer); QApplication::processEvents(); } -