
Line graph Plot in Qdialog
-
@Meenu package manager
-
Error QtCharts/QChartView: No such file or directory. Can i install QtChart Separately. I'm using QT Creator 3.5.1 based on QT 5.6.0(GCC 5.3.1 20160413, 32 bit). I was seen this example from Google. but i don't know how to implement. Kindly explain step by step.
@Meenu
hi
if u only need something really simple. ( ie no zoom etc)
you can also just draw on an image and show in a Label.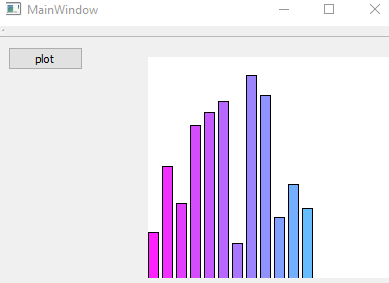
test project
https://www.dropbox.com/s/qwde8lb0fkjrrh3/mycheapgraph.zip?dl=0its few lines of code
int GetBarHeight(int MAX) {
return rand() % (MAX - 5) + 5;
}void MainWindow::on_pushButton_released() { int h = ui->label->height(); int w = ui->label->width(); QPixmap pix(w, h); QPainter paint(&pix); pix.fill( Qt::white ); paint.setPen(QColor(0, 0, 0, 255)); int y = 0; int x = 0; int bw = 10; // bar width for (int barcount = 0; barcount < 12; ++barcount) { paint.setBrush(QColor(255 - x, 34 + x, 255, 255)); paint.drawRect(x, h - GetBarHeight(h), bw, h ); x += bw + 4; } paint.end(); ui->label->setPixmap(pix); } -
@Meenu
hi
if u only need something really simple. ( ie no zoom etc)
you can also just draw on an image and show in a Label.test project
https://www.dropbox.com/s/qwde8lb0fkjrrh3/mycheapgraph.zip?dl=0its few lines of code
int GetBarHeight(int MAX) {
return rand() % (MAX - 5) + 5;
}void MainWindow::on_pushButton_released() { int h = ui->label->height(); int w = ui->label->width(); QPixmap pix(w, h); QPainter paint(&pix); pix.fill( Qt::white ); paint.setPen(QColor(0, 0, 0, 255)); int y = 0; int x = 0; int bw = 10; // bar width for (int barcount = 0; barcount < 12; ++barcount) { paint.setBrush(QColor(255 - x, 34 + x, 255, 255)); paint.drawRect(x, h - GetBarHeight(h), bw, h ); x += bw + 4; } paint.end(); ui->label->setPixmap(pix); }@mrjj Nice color gradient ;-)
-
@Meenu This might help you with Ubuntu's package manager: https://help.ubuntu.com/lts/serverguide/apt.html
-
@Meenu
hi
if u only need something really simple. ( ie no zoom etc)
you can also just draw on an image and show in a Label.test project
https://www.dropbox.com/s/qwde8lb0fkjrrh3/mycheapgraph.zip?dl=0its few lines of code
int GetBarHeight(int MAX) {
return rand() % (MAX - 5) + 5;
}void MainWindow::on_pushButton_released() { int h = ui->label->height(); int w = ui->label->width(); QPixmap pix(w, h); QPainter paint(&pix); pix.fill( Qt::white ); paint.setPen(QColor(0, 0, 0, 255)); int y = 0; int x = 0; int bw = 10; // bar width for (int barcount = 0; barcount < 12; ++barcount) { paint.setBrush(QColor(255 - x, 34 + x, 255, 255)); paint.drawRect(x, h - GetBarHeight(h), bw, h ); x += bw + 4; } paint.end(); ui->label->setPixmap(pix); }@mrjj
I want to plot line graph. so i changed the code like belowint data[255]; int i = 0; for (i = 0; i < 255; ++i) data[i] = i; for (i = 0; i < 255; ++i) paint.drawLine(i, data[i], i+1, data[i+1]);Here How to Set Lable's pixel (0,0) as bottom left corner?
Now, Graph plotting reversely(Top left corner). -
@mrjj
I want to plot line graph. so i changed the code like belowint data[255]; int i = 0; for (i = 0; i < 255; ++i) data[i] = i; for (i = 0; i < 255; ++i) paint.drawLine(i, data[i], i+1, data[i+1]);Here How to Set Lable's pixel (0,0) as bottom left corner?
Now, Graph plotting reversely(Top left corner).@Meenu
hi
you can change for painter with
painter.translate();http://doc.qt.io/qt-5/qpainter.html#translate
its not related to the label at all.
we draw on image and label just show it :) -
@Meenu This might help you with Ubuntu's package manager: https://help.ubuntu.com/lts/serverguide/apt.html
@Wieland Getting Error - chartdataset.cpp:30:36: fatal error: private/chartdataset_p.h: No such file or directory.
I was download qtcharts-opensource-src-5.7.0 and installed successfully, like from download directory.> qmake > sudo makeline chart from examples working good. i like to implement this chart in my QDialog.
Now, i came to my code and simply add#include <QtCharts/QChartView> #include <QtCharts/QLineSeries>how can i link QTChart with my *.Pro File.
-
@Meenu
hi
you can change for painter with
painter.translate();http://doc.qt.io/qt-5/qpainter.html#translate
its not related to the label at all.
we draw on image and label just show it :) -
@mrjj
I want to plot line graph. so i changed the code like belowint data[255]; int i = 0; for (i = 0; i < 255; ++i) data[i] = i; for (i = 0; i < 255; ++i) paint.drawLine(i, data[i], i+1, data[i+1]);Here How to Set Lable's pixel (0,0) as bottom left corner?
Now, Graph plotting reversely(Top left corner).@Meenu said:
so i changed the code like below
for (i = 0; i < 255; ++i) paint.drawLine(i, data[i], i+1, data[i+1]);If you cannot see the problem there add
#include <array>and changeint data[255];intostd::array<int,255> data;"La mort n'est rien, mais vivre vaincu et sans gloire, c'est mourir tous les jours"
~Napoleon BonaparteOn a crusade to banish setIndexWidget() from the holy land of Qt
-
@Meenu said:
so i changed the code like below
for (i = 0; i < 255; ++i) paint.drawLine(i, data[i], i+1, data[i+1]);If you cannot see the problem there add
#include <array>and changeint data[255];intostd::array<int,255> data; -
After install QTChart / QWT chart controls, is possible to use these controls in to QDialog box.
How to link with *.PRO File.
QWT link process :QWT_DIR = /usr/local/qwt-6.1.3 INCLUDEPATH += $$QWT_DIR/include CONFIG(debug, debug|release):LIBS += -L$$QWT_DIR\lib\ \ -lqwtd5 else:LIBS += -L$$QWT_DIR\lib\ \ -lqwt5 DEFINES += QWT_DLLis correct?