
QT Creator Serial Port Plotter
-
I'm completely new to QT Creator I have never ussed it before so I just installed it. Cause I need to change a little thing of this amazing program I'm ussing to graph serial data comming from an Arduino sensor:
https://os.mbed.com/users/borislav/notebook/serial-port-plotter/#commentform
Basically I'm doing an electrocardiogram and this program works perfectly but I need to change the colors cause is a standard medical thing to read the heart data in a white backround and the graph in color black. (this program has a black backround and a red graph).
And that's basically all I need, an executable program with just that colors, so I thought I try to edit the code but after I open this proyect in QT it appears an error:
13:37:46: Configuration is faulty. Check the Issues view for details. Error while building/deploying project prueba1 (kit: Desktop Qt 5.11.1 MSVC2015 32bit) When executing step "Make"
QT Creator needs a compiler set up to build, configure a compiler in the kit options.
How does this can be done? Step by step. Thanks so much, I'm new to this plataform.
Hi and welcome to devnet forum
Qt creator is an IDE and requires a tool chain and Qt libs in addition.
How did you install Qt creator?
For getting started with Qt see http://doc.qt.io/qt-5/windows.html
and http://doc.qt.io/qt-5/gettingstarted.html -
Hi
For faster fun, use the mingw Qt version as it comes with all included.
The visual studio version requires you to go download the compiler/debugger from Microsoft site.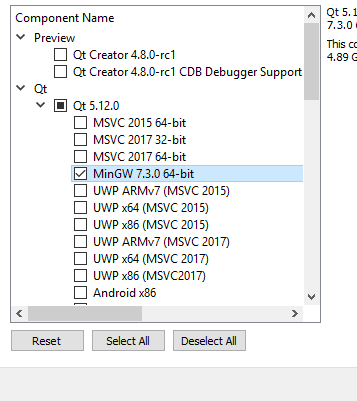
I checked , it compiles fine with mingw and the colors are easy to change.
-
Hi
For faster fun, use the mingw Qt version as it comes with all included.
The visual studio version requires you to go download the compiler/debugger from Microsoft site.I checked , it compiles fine with mingw and the colors are easy to change.
@mrjj Hi, do I just download it again after uninstalling it?, from this page
https://www.qt.io/download
and then just select the options in that image?I you could explain to me step by step ho can this be done I'll be extremely thankfull, just need to do this change in the program and the final exe file, so the electrocardiogram sensor can be seen well.
-
Hi and welcome to devnet forum
Qt creator is an IDE and requires a tool chain and Qt libs in addition.
How did you install Qt creator?
For getting started with Qt see http://doc.qt.io/qt-5/windows.html
and http://doc.qt.io/qt-5/gettingstarted.html -
@koahnig Hi thanks, I downloaded from the official site and selected all the options available when installing. Now I'm reinstalling it again.
@priscilla-v said in QT Creator Serial Port Plotter:
selected all the options available when installing
I would not recommend doing that! That will eat about 80gb of hard disk memory!! And that's if you only selected everything from 5.12.0
You only need to select what @mrjj showed, everything else should be preselected for you.
-
Hi
So after you installed the mingw Qt version. ( and only that one :)I assumed you unzipped the project to some folder.
You go to that folder and double click on the SerialPortPlotter.pro
Now in Left side,
Click on the .pro file and put a # in front of line 31.
The file is not included in project but seems not to matter so we just comment it out.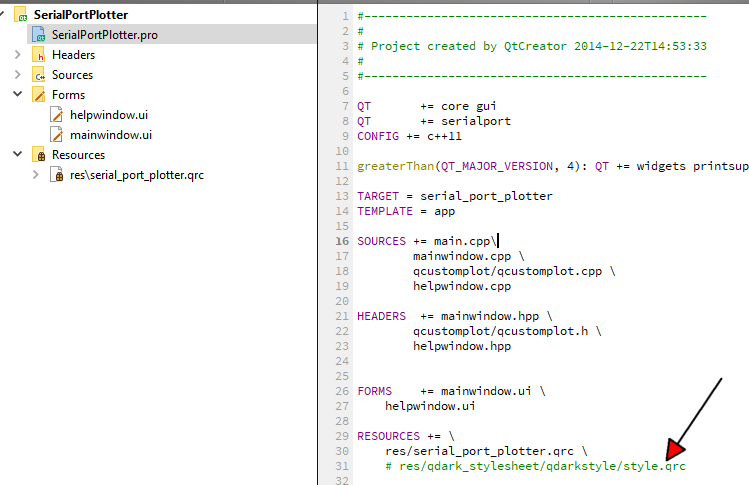
Now press the build/run button

Regarding colors.
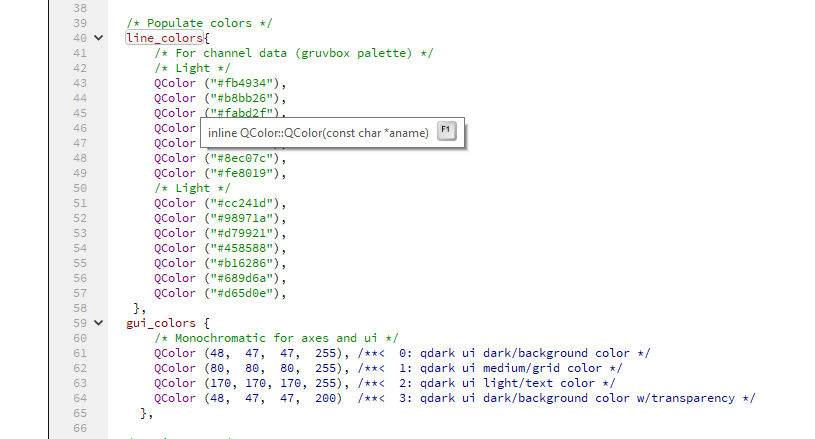
In mainwindow.cpp
Line 59 , the var gui_colors contains the color used.
You can change them thereAlso its used at line 185
/* Background for the plot area */
ui->plot->setBackground (gui_colors[0]);so fast fix is just to do
ui->plot->setBackground (Qt::white);
To get white background.The line color uses
ui->plot->graph()->setPen (line_colors[channels % CUSTOM_LINE_COLORS]);
so you can change the line_colors array to get new ones.So basically the colors comes from
In mainwindow.cpp
-
Hi
So after you installed the mingw Qt version. ( and only that one :)I assumed you unzipped the project to some folder.
You go to that folder and double click on the SerialPortPlotter.pro
Now in Left side,
Click on the .pro file and put a # in front of line 31.
The file is not included in project but seems not to matter so we just comment it out.Now press the build/run button
Regarding colors.
In mainwindow.cpp
Line 59 , the var gui_colors contains the color used.
You can change them thereAlso its used at line 185
/* Background for the plot area */
ui->plot->setBackground (gui_colors[0]);so fast fix is just to do
ui->plot->setBackground (Qt::white);
To get white background.The line color uses
ui->plot->graph()->setPen (line_colors[channels % CUSTOM_LINE_COLORS]);
so you can change the line_colors array to get new ones.So basically the colors comes from
In mainwindow.cpp
@mrjj Thank you so much, it worked perfectly! the graph now is working as I needed for this project :D !

-
@mrjj Thank you so much, it worked perfectly! the graph now is working as I needed for this project :D !
@priscilla-v
Super. good work.
Good luck with project. -
@mrjj Thank you so much, it worked perfectly! the graph now is working as I needed for this project :D !
Good to see that you managed to get around the obstacles so fast.
Please mark your post as solved.
Have fun using Qt.
-
@priscilla-v
Super. good work.
Good luck with project.@mrjj
Hi, I have a question maybe you can help me with this.
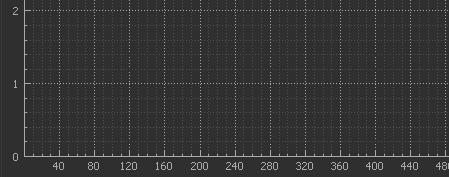
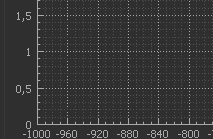
In this program how could I change the values in the X axis of the grid, to measure each one 40 mili seconds.
And then modify the Y axis to be a square, and not the rectangle shape that conforms each part of the grid right now.
And can you think of a way to just set default values in the "Plot Controls" so the program always start like this and have no need to configure it everytime? -
@mrjj
Hi, I have a question maybe you can help me with this.
In this program how could I change the values in the X axis of the grid, to measure each one 40 mili seconds.
And then modify the Y axis to be a square, and not the rectangle shape that conforms each part of the grid right now.
And can you think of a way to just set default values in the "Plot Controls" so the program always start like this and have no need to configure it everytime?Hi
Its controlled via the QCPAxisTicker
Im not sure if you mean the Big Ticks or the Sub Ticks.
There is lots of info here
https://www.qcustomplot.com/index.php/tutorials/basicplottingAnyway for the big Ticks.
if you add to
void MainWindow::setupPlot()
around line 220QSharedPointer<QCPAxisTickerFixed> fixedTicker(new QCPAxisTickerFixed); ui->plot->xAxis->setTicker(fixedTicker); fixedTicker->setTickStep(40.0); fixedTicker->setScaleStrategy(QCPAxisTickerFixed::ssNone);It looks like this
Which might be what you want.-
Y axis to be a square,
Well that depends entirely on the y range and step versus the x
-
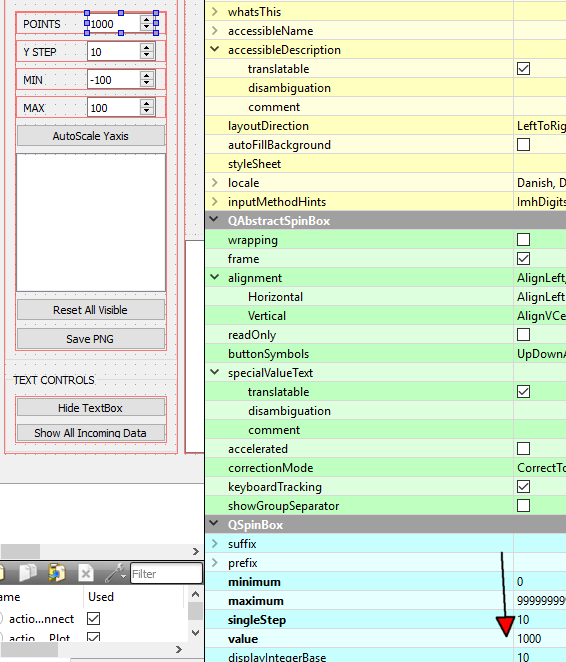
"Plot Controls" new default values.
You can click on the UI file and alter them there
-
-
Hi
Its controlled via the QCPAxisTicker
Im not sure if you mean the Big Ticks or the Sub Ticks.
There is lots of info here
https://www.qcustomplot.com/index.php/tutorials/basicplottingAnyway for the big Ticks.
if you add to
void MainWindow::setupPlot()
around line 220QSharedPointer<QCPAxisTickerFixed> fixedTicker(new QCPAxisTickerFixed); ui->plot->xAxis->setTicker(fixedTicker); fixedTicker->setTickStep(40.0); fixedTicker->setScaleStrategy(QCPAxisTickerFixed::ssNone);It looks like this
Which might be what you want.-
Y axis to be a square,
Well that depends entirely on the y range and step versus the x
-
"Plot Controls" new default values.
You can click on the UI file and alter them there
@mrjj Thank you so much :D
-
-
Hi, how would you get each frame of the small ones to measure 40 milliseconds? I was trying but I can not achieve it.

-
Hi, how would you get each frame of the small ones to measure 40 milliseconds? I was trying but I can not achieve it.
@priscilla-v
Hi
Im not sure how to get change that.
You could try ask here
https://www.qcustomplot.com/index.php/support/forum/
Its the actual plotter being used in the project. -
@priscilla-v
Hi
Im not sure how to get change that.
You could try ask here
https://www.qcustomplot.com/index.php/support/forum/
Its the actual plotter being used in the project.@mrjj
Hi, I managed to change the little squares values to 40ms, which is what I needed, though it only look like this when I haven't clicked the Play button. I commented line 208, and add the code in line 210.
When clicked, it changes all the x-axis configuration.
Do you know why is this happening?When I run the program

When I click play button

(I don't mind the numbers written in the scale like 0.25, 0.5 , 0.75 or 50, 100, 150 etc I just calculated that 20 of those I think they are called ticks is equivalent to 4 seconds, and each one has 5 subticks so, when i did the math realize that each subtick would be 40ms that way)
-
@priscilla-v
Hi
Im not sure how to get change that.
You could try ask here
https://www.qcustomplot.com/index.php/support/forum/
Its the actual plotter being used in the project. -
@mrjj Excuse one more question, how could you achieve a 50 Hz low pass filter in this serial plotter software?
@priscilla-v
Hi welcome back
funny enough, its being discussed here
https://forum.qt.io/topic/98570/implement-low-pass-filter
for same program :) -
This is my ECG in a noise-free environment.

When the charger is connected to the PC but not to the power outlet.

When the PC is near any outlet.

When the PC is connected to the electrical network.

I tried to use this piece of code but there was no change.

-
Hi
well it seems the code only
does an assignment to a double variable.
Where is the actual filter function ?