
QT Creator Serial Port Plotter
-
@mrjj Thank you so much, it worked perfectly! the graph now is working as I needed for this project :D !

@priscilla-v
Super. good work.
Good luck with project. -
@mrjj Thank you so much, it worked perfectly! the graph now is working as I needed for this project :D !
Good to see that you managed to get around the obstacles so fast.
Please mark your post as solved.
Have fun using Qt.
-
@priscilla-v
Super. good work.
Good luck with project.@mrjj
Hi, I have a question maybe you can help me with this.
In this program how could I change the values in the X axis of the grid, to measure each one 40 mili seconds.
And then modify the Y axis to be a square, and not the rectangle shape that conforms each part of the grid right now.
And can you think of a way to just set default values in the "Plot Controls" so the program always start like this and have no need to configure it everytime? -
@mrjj
Hi, I have a question maybe you can help me with this.
In this program how could I change the values in the X axis of the grid, to measure each one 40 mili seconds.
And then modify the Y axis to be a square, and not the rectangle shape that conforms each part of the grid right now.
And can you think of a way to just set default values in the "Plot Controls" so the program always start like this and have no need to configure it everytime?Hi
Its controlled via the QCPAxisTicker
Im not sure if you mean the Big Ticks or the Sub Ticks.
There is lots of info here
https://www.qcustomplot.com/index.php/tutorials/basicplottingAnyway for the big Ticks.
if you add to
void MainWindow::setupPlot()
around line 220QSharedPointer<QCPAxisTickerFixed> fixedTicker(new QCPAxisTickerFixed); ui->plot->xAxis->setTicker(fixedTicker); fixedTicker->setTickStep(40.0); fixedTicker->setScaleStrategy(QCPAxisTickerFixed::ssNone);It looks like this
Which might be what you want.-
Y axis to be a square,
Well that depends entirely on the y range and step versus the x
-
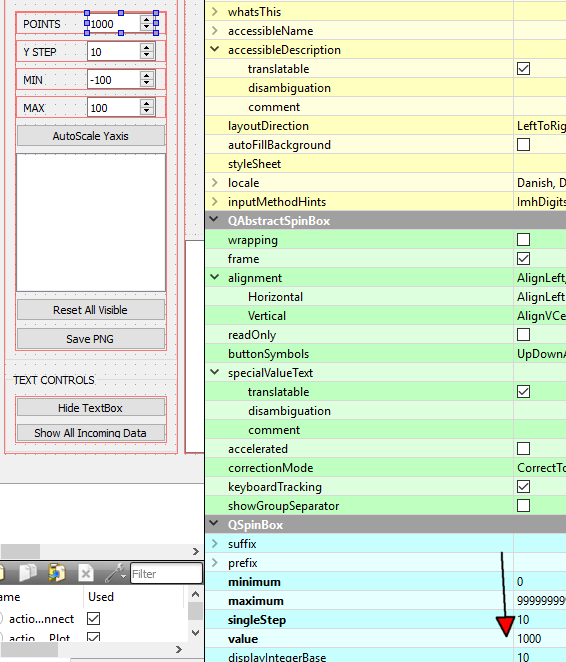
"Plot Controls" new default values.
You can click on the UI file and alter them there
-
-
Hi
Its controlled via the QCPAxisTicker
Im not sure if you mean the Big Ticks or the Sub Ticks.
There is lots of info here
https://www.qcustomplot.com/index.php/tutorials/basicplottingAnyway for the big Ticks.
if you add to
void MainWindow::setupPlot()
around line 220QSharedPointer<QCPAxisTickerFixed> fixedTicker(new QCPAxisTickerFixed); ui->plot->xAxis->setTicker(fixedTicker); fixedTicker->setTickStep(40.0); fixedTicker->setScaleStrategy(QCPAxisTickerFixed::ssNone);It looks like this
Which might be what you want.-
Y axis to be a square,
Well that depends entirely on the y range and step versus the x
-
"Plot Controls" new default values.
You can click on the UI file and alter them there
@mrjj Thank you so much :D
-
-
Hi, how would you get each frame of the small ones to measure 40 milliseconds? I was trying but I can not achieve it.

-
Hi, how would you get each frame of the small ones to measure 40 milliseconds? I was trying but I can not achieve it.
@priscilla-v
Hi
Im not sure how to get change that.
You could try ask here
https://www.qcustomplot.com/index.php/support/forum/
Its the actual plotter being used in the project. -
@priscilla-v
Hi
Im not sure how to get change that.
You could try ask here
https://www.qcustomplot.com/index.php/support/forum/
Its the actual plotter being used in the project.@mrjj
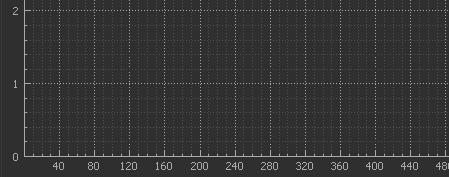
Hi, I managed to change the little squares values to 40ms, which is what I needed, though it only look like this when I haven't clicked the Play button. I commented line 208, and add the code in line 210.
When clicked, it changes all the x-axis configuration.
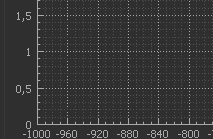
Do you know why is this happening?When I run the program

When I click play button

(I don't mind the numbers written in the scale like 0.25, 0.5 , 0.75 or 50, 100, 150 etc I just calculated that 20 of those I think they are called ticks is equivalent to 4 seconds, and each one has 5 subticks so, when i did the math realize that each subtick would be 40ms that way)
-
@priscilla-v
Hi
Im not sure how to get change that.
You could try ask here
https://www.qcustomplot.com/index.php/support/forum/
Its the actual plotter being used in the project. -
@mrjj Excuse one more question, how could you achieve a 50 Hz low pass filter in this serial plotter software?
@priscilla-v
Hi welcome back
funny enough, its being discussed here
https://forum.qt.io/topic/98570/implement-low-pass-filter
for same program :) -
This is my ECG in a noise-free environment.

When the charger is connected to the PC but not to the power outlet.

When the PC is near any outlet.

When the PC is connected to the electrical network.

I tried to use this piece of code but there was no change.

-
Hi
well it seems the code only
does an assignment to a double variable.
Where is the actual filter function ? -
It returns this error

-
Hi
oh, you have to move the function outside ( over ) the current function.
you define a function inside other function which it complains about. -
Thank you very much for all the help in this forum, it was very helpful. :)
-
Thank you very much for all the help in this forum, it was very helpful. :)
@priscilla-v said in QT Creator Serial Port Plotter:
Thank you very much for all the help in this forum, it was very helpful. :)
Hi! Did you manage to make fixed tick and subtick count? I need to have ticks every 10mm and subticks every 2mm.