
Connecting Qt to data generated by formulas
-
wrote on 28 Jan 2017, 02:10 last edited by Robert M. Koretsky
If I have some C++ formulas that generate numbers as values, how do I get that into Qt so that it can put the values into Qt graphics?
In other words, how do you hook numerical values to QT so that you can get graphics to be displayed, either in dialog boxes or anything Qt is capable of showing as graphics?
Not talking about here about spreadsheet or database values, but numerical values generated by either simple or complex formulas. The way I see it, a traditional graphics-capable program has two parts: a part that generates the values, and a part that displays the values as some kind of picture. How is Qt different from this? Some traditional graphics programs write the data to files, and then the graphics portion opens the files, and displays the data. Can Qt do this? -
From your description I feel you need some data visualisation classes. Can you check QtCharts ?
-
From your description I feel you need some data visualisation classes. Can you check QtCharts ?
wrote on 28 Jan 2017, 05:36 last edited by Robert M. KoretskyThanks for this considerate and most excellent reply!
@dheerendra surely you mean Qt classes, I'm a newbie at Qt but not at connecting data to graphics. I'll look at the Qt facility you suggest. Just an observation here, available beginner docs don't get to your suggested facility as far as I can see. -
Hi and welcome to the forum
There are many ways to both input data and show/draw/plot on the screen.
Qt is for programming and it can read and display data, any way you program it. :)For reading data from file, you could use QFile. http://doc.qt.io/qt-5/qfile.html
Example:
int GetBarHeight(int MAX) {
  return rand() % (MAX - 5) + 5;
}

void MainWindow::on_pushButton_released() {

  int h = ui->label->height();
  int w = ui->label->width();

  QPixmap pix(w, h);
  QPainter paint(&pix);
  pix.fill( Qt::white );
  paint.setPen(QColor(0, 0, 0, 255));


  int y = 0;
  int x = 0;

  int bw = 10; // bar width
  for (int barcount = 0; barcount < 12; ++barcount) {
    paint.setBrush(QColor(255 - x, 34 + x, 255, 255));
    paint.drawRect(x, h - GetBarHeight(h),  bw, h );
    x += bw + 4;
  }
  paint.end();
  ui->label->setPixmap(pix);
}
Gives this:
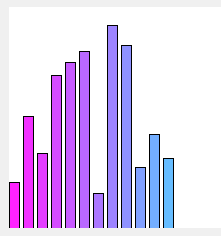
this is super poor mans graph. for anything serious, use
http://www.qcustomplot.com/
or QtchartIf you just want to draw on screen then QPainter is the one to read docs on.
-
Hi and welcome to the forum
There are many ways to both input data and show/draw/plot on the screen.
Qt is for programming and it can read and display data, any way you program it. :)For reading data from file, you could use QFile. http://doc.qt.io/qt-5/qfile.html
Example:
int GetBarHeight(int MAX) {
  return rand() % (MAX - 5) + 5;
}

void MainWindow::on_pushButton_released() {

  int h = ui->label->height();
  int w = ui->label->width();

  QPixmap pix(w, h);
  QPainter paint(&pix);
  pix.fill( Qt::white );
  paint.setPen(QColor(0, 0, 0, 255));


  int y = 0;
  int x = 0;

  int bw = 10; // bar width
  for (int barcount = 0; barcount < 12; ++barcount) {
    paint.setBrush(QColor(255 - x, 34 + x, 255, 255));
    paint.drawRect(x, h - GetBarHeight(h),  bw, h );
    x += bw + 4;
  }
  paint.end();
  ui->label->setPixmap(pix);
}
Gives this:
this is super poor mans graph. for anything serious, use
http://www.qcustomplot.com/
or QtchartIf you just want to draw on screen then QPainter is the one to read docs on.
wrote on 28 Jan 2017, 16:35 last edited by@mrjj much thanks for this excellent repy! On first glance, it appears to me that reading the data from a file (which perhaps was generated by some module that contained assignment statements using simple or complex formulae) and "displaying" it as Qt graphics are exactly as I said in my initial question: two totally separate components. This is as I found it in Xlib and Xcb programing in C. So in your reply, you have given me a link to help on file operations, and then a demonstration example of how Qt does graphics- both, on the surface at least, with their code unrelated. That's fine. It is the linking of the two components, or as I prefer to think of it, the "hooking" of the output of the assignment statement module (difficult for me to not think in terms of modular programs!) to the Qt graphical component, that is of concern to me. Even in the QtCharts signature example that Dheerendra steered me to in his most excellent reply,
http://doc.qt.io/qt-5/qtcharts-linechart-main-cpp.html
those two components are clearly there, but not auspiciously delineated.
I'm browsing through the on-line Qt docs, and some introductory books, such as "C++ GUI Programming with Qt 4, Second Edition by Jasmin Blanchette; Mark Summerfield", and there appears to be little beginner information that addresses my question.
Thanks again for your considerate and excellent reply!
Sincerely,
Robert M. Koretsky -
@mrjj much thanks for this excellent repy! On first glance, it appears to me that reading the data from a file (which perhaps was generated by some module that contained assignment statements using simple or complex formulae) and "displaying" it as Qt graphics are exactly as I said in my initial question: two totally separate components. This is as I found it in Xlib and Xcb programing in C. So in your reply, you have given me a link to help on file operations, and then a demonstration example of how Qt does graphics- both, on the surface at least, with their code unrelated. That's fine. It is the linking of the two components, or as I prefer to think of it, the "hooking" of the output of the assignment statement module (difficult for me to not think in terms of modular programs!) to the Qt graphical component, that is of concern to me. Even in the QtCharts signature example that Dheerendra steered me to in his most excellent reply,
http://doc.qt.io/qt-5/qtcharts-linechart-main-cpp.html
those two components are clearly there, but not auspiciously delineated.
I'm browsing through the on-line Qt docs, and some introductory books, such as "C++ GUI Programming with Qt 4, Second Edition by Jasmin Blanchette; Mark Summerfield", and there appears to be little beginner information that addresses my question.
Thanks again for your considerate and excellent reply!
Sincerely,
Robert M. Koretsky@Robert-M.-Koretsky said in Connecting Qt to data generated by formulas:
It is the linking of the two components, or as I prefer to think of it, the "hooking" of the output of the assignment statement module (difficult for me to not think in terms of modular programs!) to the Qt graphical component, that is of concern to me.
That's what signals and slots are for. But as any C++ program (or C program for that matter) there's always controller code that knows about both modules/classes or w/e you want to call them. The "auspicious delineation", as you so eloquently have put it, is up to the person writing the code. Qt only provides tools to do so, there's no ready out-of-the-box just-plug-and-play solution.
-
@Robert-M.-Koretsky said in Connecting Qt to data generated by formulas:
It is the linking of the two components, or as I prefer to think of it, the "hooking" of the output of the assignment statement module (difficult for me to not think in terms of modular programs!) to the Qt graphical component, that is of concern to me.
That's what signals and slots are for. But as any C++ program (or C program for that matter) there's always controller code that knows about both modules/classes or w/e you want to call them. The "auspicious delineation", as you so eloquently have put it, is up to the person writing the code. Qt only provides tools to do so, there's no ready out-of-the-box just-plug-and-play solution.
wrote on 1 Feb 2017, 02:01 last edited by@kshegunov I think everyone interested in this post should look at the primary examples of QCustomPlot. In his examples, he clearly delineates what code is generating the numbers, and what Qt graphics are displaying it.
1/7