Skip to content
  • Categories
  • Recent
  • Tags
  • Popular
  • Users
  • Groups
  • Search
  • Get Qt Extensions
  • Unsolved
Collapse
Brand Logo
  1. Home
  2. Qt Development
  3. General and Desktop
  4. Strategy for displaying big histograms (1024 bins) in QtChart
Forum Update on Monday, May 27th 2025

Strategy for displaying big histograms (1024 bins) in QtChart

Scheduled Pinned Locked Moved Unsolved General and Desktop
3 Posts 2 Posters 299 Views
  • Oldest to Newest
  • Newest to Oldest
  • Most Votes
Reply
  • Reply as topic
Log in to reply
This topic has been deleted. Only users with topic management privileges can see it.
  • F Offline
    F Offline
    Frostybeard 0
    wrote on last edited by
    #1

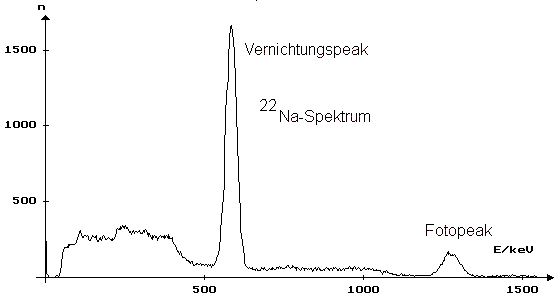
    I downloaded some data from a university website for atomic spectra. The data files have 1024 different values (bins) which are supposed to be shown in a histogram. The different values represent number of detections at the 1024 different power levels coming from a photo detector. When displayed in a bar chart, it shows identifiable atomic gamma spectra for the different isotopes.

    I am currently using a bar chart with 1024 bars, but it doesn't show up so well. It creates some sort of moire pattern.

    Any ideas how to create a good looking spectrum histogram?

    Here's an example of such a spectrum: Na22
    1 Reply Last reply
    0
    • M Offline
      M Offline
      mchinand
      wrote on last edited by
      #2

      What type of chart did you use? I would try a QLineSeries.

      1 Reply Last reply
      1
      • F Offline
        F Offline
        Frostybeard 0
        wrote on last edited by
        #3

        Thanks, I will give that a try.

        1 Reply Last reply
        0

        • Login

        • Login or register to search.
        • First post
          Last post
        0
        • Categories
        • Recent
        • Tags
        • Popular
        • Users
        • Groups
        • Search
        • Get Qt Extensions
        • Unsolved