Skip to content
  • Categories
  • Recent
  • Tags
  • Popular
  • Users
  • Groups
  • Search
  • Get Qt Extensions
  • Unsolved
Collapse
Brand Logo
  1. Home
  2. Qt Development
  3. General and Desktop
  4. Strategy for displaying big histograms (1024 bins) in QtChart
Forum Updated to NodeBB v4.3 + New Features

Strategy for displaying big histograms (1024 bins) in QtChart

Scheduled Pinned Locked Moved Unsolved General and Desktop
3 Posts 2 Posters 301 Views 2 Watching
  • Oldest to Newest
  • Newest to Oldest
  • Most Votes
Reply
  • Reply as topic
Log in to reply
This topic has been deleted. Only users with topic management privileges can see it.
  • F Offline
    F Offline
    Frostybeard 0
    wrote on last edited by
    #1

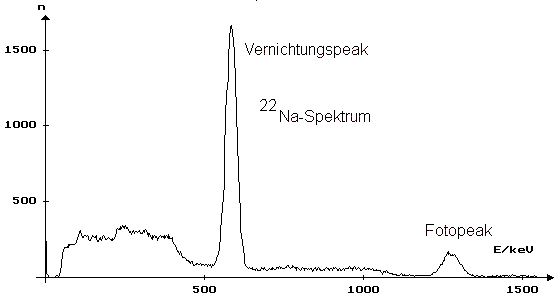
    I downloaded some data from a university website for atomic spectra. The data files have 1024 different values (bins) which are supposed to be shown in a histogram. The different values represent number of detections at the 1024 different power levels coming from a photo detector. When displayed in a bar chart, it shows identifiable atomic gamma spectra for the different isotopes.

    I am currently using a bar chart with 1024 bars, but it doesn't show up so well. It creates some sort of moire pattern.

    Any ideas how to create a good looking spectrum histogram?

    Here's an example of such a spectrum: Na22
    1 Reply Last reply
    0
    • M Offline
      M Offline
      mchinand
      wrote on last edited by
      #2

      What type of chart did you use? I would try a QLineSeries.

      1 Reply Last reply
      1
      • F Offline
        F Offline
        Frostybeard 0
        wrote on last edited by
        #3

        Thanks, I will give that a try.

        1 Reply Last reply
        0

        • Login

        • Login or register to search.
        • First post
          Last post
        0
        • Categories
        • Recent
        • Tags
        • Popular
        • Users
        • Groups
        • Search
        • Get Qt Extensions
        • Unsolved