Skip to content
  • Categories
  • Recent
  • Tags
  • Popular
  • Users
  • Groups
  • Search
  • Get Qt Extensions
  • Unsolved
Collapse
Brand Logo
  1. Home
  2. Qt Development
  3. General and Desktop
  4. Qwt PlotCurve does not apply as "Line"
Qt 6.11 is out! See what's new in the release blog

Qwt PlotCurve does not apply as "Line"

Scheduled Pinned Locked Moved Unsolved General and Desktop
3 Posts 3 Posters 544 Views 1 Watching
  • Oldest to Newest
  • Newest to Oldest
  • Most Votes
Reply
  • Reply as topic
Log in to reply
This topic has been deleted. Only users with topic management privileges can see it.
  • F Offline
    F Offline
    Flung Dung
    wrote on last edited by
    #1

    Hello human,

    I try to create a simple sinus Line with qwt into a QwtPlot.

    My problem is, that I don't get the line out of the samples I save in my QwtPlotCurve. As far as I understand the documentation I have to call setStyle(QwtPlotCurve::Lines) to connect the samples to a curve but it doesn't work for me.

    I am new in c++ and qt so maybe anyone can answer this. probably something simple but I couldn't find out for hours....

    Here's the relevant code. before I call replot() at the end I check for the style and its ture...!

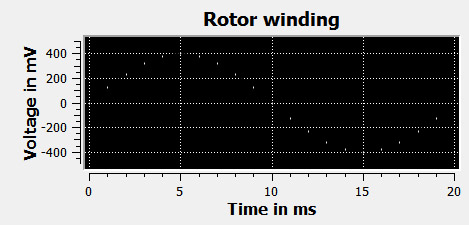
       xData = new double[(int)plot_r->axisScaleDiv(2).upperBound()];
        yData = new double[(int)plot_r->axisScaleDiv(2).upperBound()];
        curve_rotor = new QwtPlotCurve("Rotor");
        curve_rotor->setStyle(QwtPlotCurve::Lines);
    
    
        QwtSymbol *sym=new QwtSymbol(QwtSymbol::Ellipse,QBrush(Qt::white),QPen(Qt::white),QSize(1,1));
    
        curve_rotor->setRenderHint( QwtPlotItem::RenderAntialiased, true );
        curve_rotor->setSymbol(sym);
    
        
        for(int i = 0; i < (int)plot_r->axisScaleDiv(2).upperBound(); i++)
        {
            xData[i] = i;
            yData[i] = 400 * sin(2*M_PI*50*i*0.001);
        }
        curve_rotor->setSamples(xData, yData, (int)plot_r->axisScaleDiv(2).upperBound());
    
        curve_rotor->attach(plot_r);
    
    
        if(curve_rotor->style() == QwtPlotCurve::Lines)
        {
            std::cout <<" Yes it is" << std::endl;
        }
        plot_r->replot();


    How it looks at the moment:
    alt text

    1 Reply Last reply
    0
    • SGaistS Offline
      SGaistS Offline
      SGaist
      Lifetime Qt Champion
      wrote on last edited by
      #2

      Hi,

      Can you provide a complete minimal buildable example ?
      That will make things easier for people to help you.

      Interested in AI ? www.idiap.ch
      Please read the Qt Code of Conduct - https://forum.qt.io/topic/113070/qt-code-of-conduct

      1 Reply Last reply
      0
      • U Offline
        U Offline
        uwer
        wrote on last edited by
        #3

        The default curve line pen is black - guess you simply don't see the lines because you don't see black lines on a black canvas.

        1 Reply Last reply
        1

        • Login

        • Login or register to search.
        • First post
          Last post
        0
        • Categories
        • Recent
        • Tags
        • Popular
        • Users
        • Groups
        • Search
        • Get Qt Extensions
        • Unsolved