
Learn Graphics view framework
-
Hi,
Can you explain what a six axis IMU is ?
-
Hi
Do you mean a gyroscope ?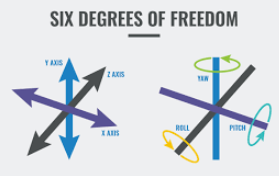
ah, it is a term.
"An IMU is a specific type of sensor that measures angular rate, force and sometimes magnetic field. IMUs are composed of a 3-axis accelerometer and a 3-axis gyroscope, which would be considered a 6-axis IMU. "So do you have an idea of how you want to visualize it and ask how to create that in Graphics View Framework or do you ask about ideas how to actually visualize it ?
Like here ?
http://www.starlino.com/imu_guide.html -
Hi
Do you mean a gyroscope ?ah, it is a term.
"An IMU is a specific type of sensor that measures angular rate, force and sometimes magnetic field. IMUs are composed of a 3-axis accelerometer and a 3-axis gyroscope, which would be considered a 6-axis IMU. "So do you have an idea of how you want to visualize it and ask how to create that in Graphics View Framework or do you ask about ideas how to actually visualize it ?
Like here ?
http://www.starlino.com/imu_guide.html@mrjj Thanks a lot :)
As a first step, I'm looking forward to an example to show 6 axis values as a line graph (angle and acceleration vs. time) using the Graphics View Framework. I need to see the sensor values as follows:
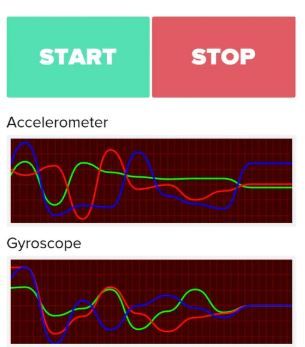
On the other hand, it took me a bit late to know about QCustomPlot, that has built entirely for this purpose. I'm trying to fiddle with some static plots using QCustomPlot. Now the next step is to write IMU sensor values (3 axis accelerometer and 3 axis gyro).