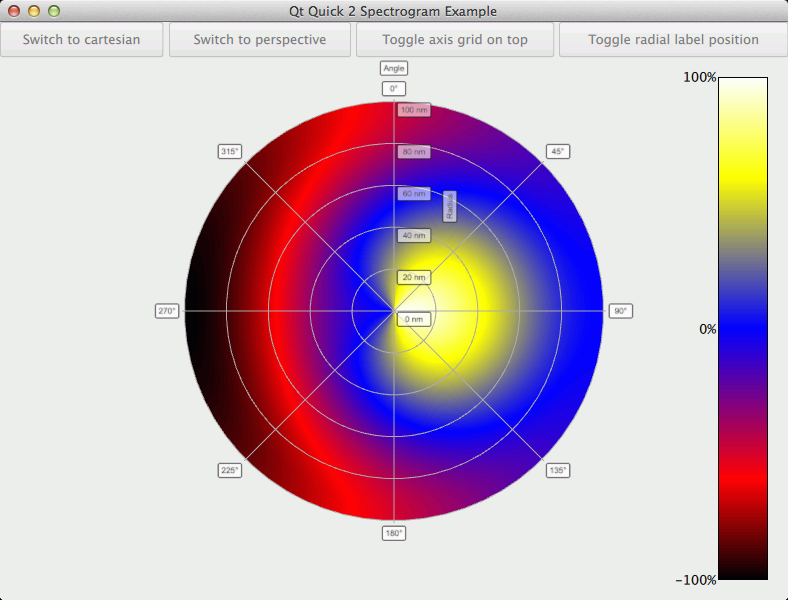
Change direction of polar data visualization
-
@beecksche
Hey,
In physics we call this parity. Flipping the coordinates will do what you want (i.e. if you make a reflection through the coordinate system's 0). I may be wrong, but probably the easiest way to do what you want is to actually change the coordinate system. In Qt it goes from left to right and top to bottom, if you switch it somehow (I don't know QML and I have no idea how this can be accomplished) so that it goes right to left, and bottom to top then you should be good to go.
I hope that helps somewhat.Kind regards.
-
@kshegunov
Thanks for your reply.The doc says:
The X axis becomes the angular axis and the Z axis becomes the radial axis. Polar mode is not available for bar graphs.
I can change the reversed setting of the X axis. So i should change the direction, or am i wrong?
Edit:
I have tested the reveres setting, but the graph doesn't change. -
@beecksche
Hi,
I'm sorry I didn't realize you're using that module, I thought you're doing the graph yourself. Sadly, I have no idea how I can help with the data visualization module. I believe it was included in opensource only recently, so I haven't any experience with it.Kind regards.
-
@kshegunov
Oh sorry! It is my fault, i didn't mentioned anywhere.Since Qt 5.7 the Qt Data Visualization module is available under the GPL license, see this blog post.
Now i have read some informations about the coordinate systems:
The coordinate system used in the module is called azimuth system and it is mainly used in geography:

For me as engineer, it would be interesting to use the "real" polar system ;-). Where the positve angle is count anti clockwise
 .
.But so far i haven't found any settings to change the systems.
-
@beecksche
Hi,I can change the reversed setting of the X axis. So i should change the direction, or am i wrong?
No I meant you should reflect the rectangular coordinate. (There's an error in my first post, as you need to reflect only one of the coordinates, since this is a 2 dimensional space). What I mean is that instead of feeding
(x, y, color)tuples to the chart you feed it(-x, y, color). This would reverse the "handedness", but also might screw up the labels ... I don't know ... try it out.Since Qt 5.7 the Qt Data Visualization module is available under the GPL license, see this blog post.
Yes, that's what I mean. Until very recently it was available only for commercial users.
The coordinate system used in the module is called azimuth system and it is mainly used in geography
That's because they "look from" the center of the earth, not from the pole as one would expect. But in any case it's a very strange choice on account of the module developers, I'll grant you.
For me as engineer, it would be interesting to use the "real" polar system
I sympathize. I being a physicist wouldn't ever even consider using a left-handed coordinate system ...
My advice is to address the developers directly on the mailing list if in a day or two you don't get a better answer here.Kind regards.
-
@kshegunov
The data for the visualization is stored in cylindrical coordinates r, phi and z.I tried to change the angle phi to -phi, but then no visualization is rendered.
The data is stored in a QItemModelSurfaceDataProxy, maybe i find some hints there!
I'm going to write the developers, like you suggested. Thanks a lot!
-
@beecksche said:
I tried to change the angle phi to -phi, but then no visualization is rendered.
It wouldn't make any difference ordinarily, but are you sure the drawing can handle negative angles ...? You could do a very fast conversion of angles (after the inversion
phi = -phi):angle = std::fmod(angle, 360); if (angle < 0) angle += 360; // Angle is now always positive ...Sorry I couldn't be of more help. Good luck!

