Is there way to create the simplest bar chart?
-
Hey, I'm trying to reach the simplest bar chart, but I'm having so many problems, look at the picture, so you'll be able to understand my problem, it's a little bit cunfused problem
Hi @orzel1244
What are you trying to do when you click?In the following example (from the Qt QML Charts example), you have 3 series laid out as you wanted:
Then, to test the click I added theonClickedhandler, in which I use the attachedindexproperty of eachBarSetto get the clicked value:ChartView { title: "Bar series" anchors.fill: parent legend.alignment: Qt.AlignBottom antialiasing: true BarSeries { id: mySeries axisX: BarCategoryAxis { categories: ["2007", "2008", "2009", "2010", "2011", "2012" ] } BarSet { label: "Bob" values: [2, 2, 3, 4, 5, 6] onClicked: console.debug("Bob clicked!" + index + " " + this.at(index)) } BarSet { label: "Susan" values: [5, 1, 2, 4, 1, 7] onClicked: console.debug("Susan clicked!" + index + " " + this.at(index)) } BarSet { label: "James" values: [3, 5, 8, 13, 5, 8] onClicked: console.debug("James clicked!" + index + " " + this.at(index)) } } }So each item in each of the bar sets is individually clickable and its value accessible, which is what I suppose you are trying to achieve, since I assume you are trying to show the value when hovered.
-
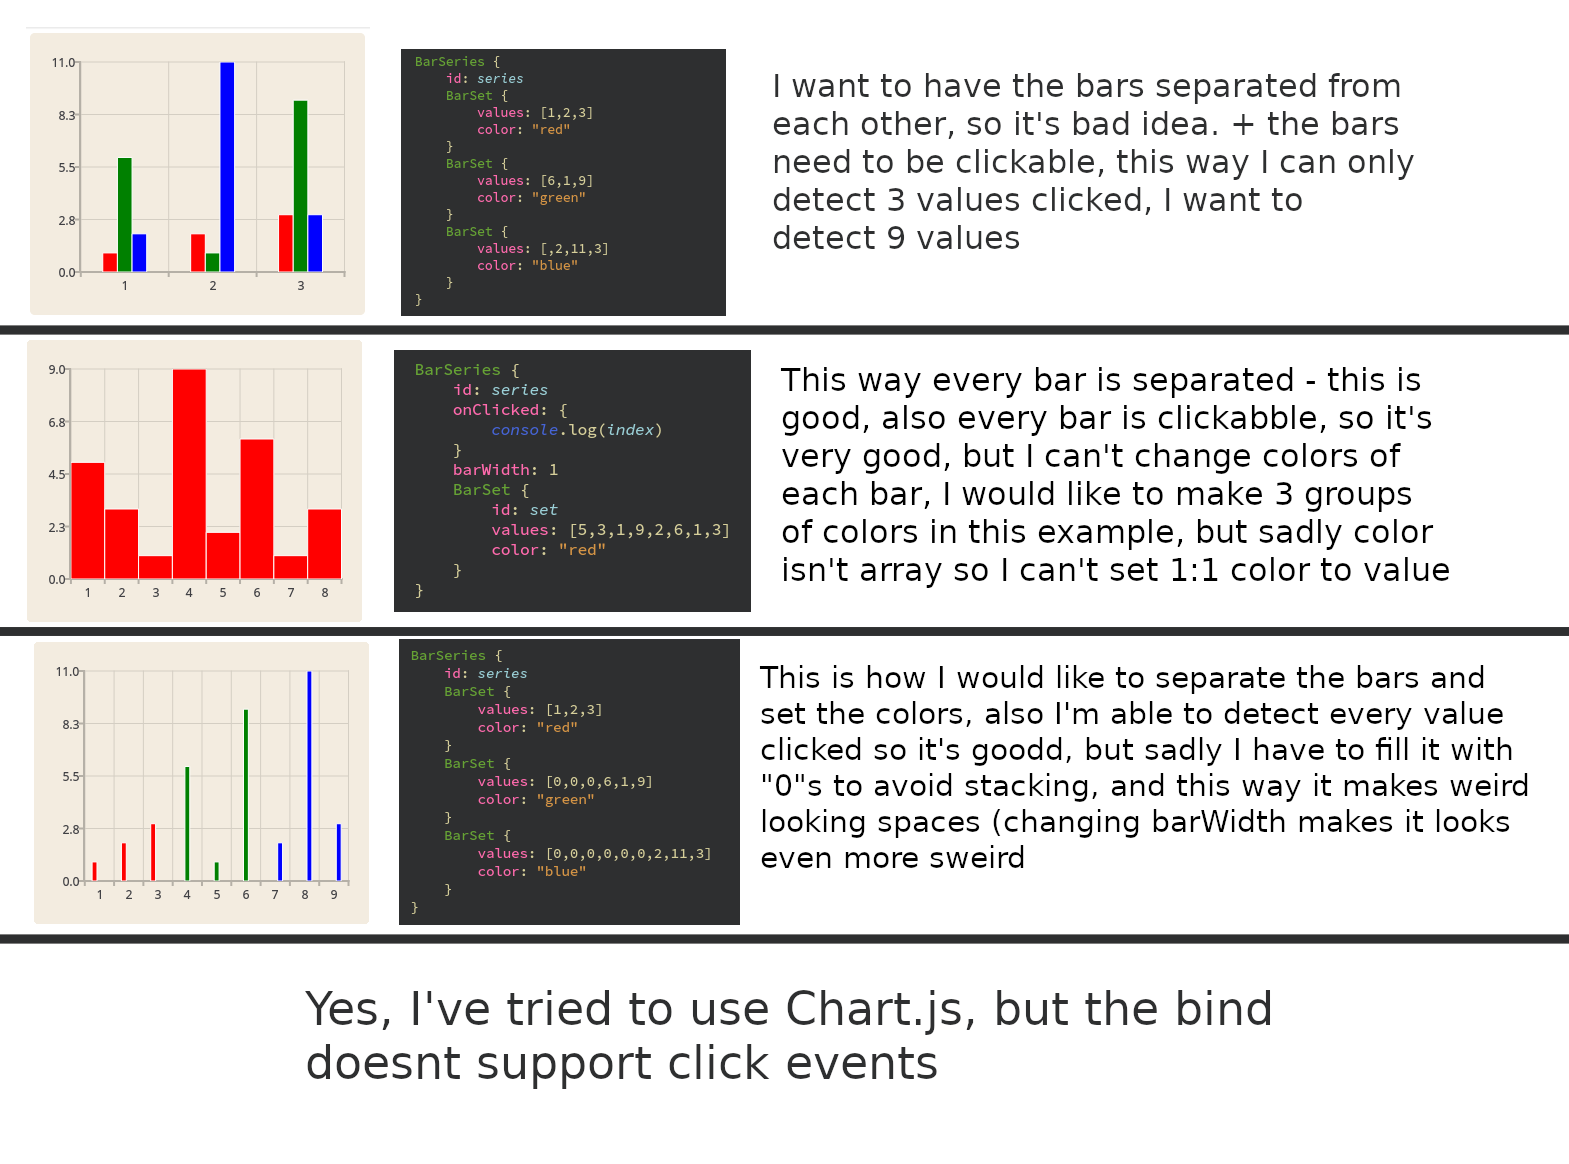
The thing is, I dont want to stack these bars, I want to achive result from picture 2 and 3, I mean every bar is inddependent, and the bars have individual colors, It's nice to know that I can make every bar clickable on this first image, but it doesn't help me much, because I don't want to stack the bars like that.
Basicly I want to achive result from second picture, but with ability to change color of each bar
-
The thing is, I dont want to stack these bars, I want to achive result from picture 2 and 3, I mean every bar is inddependent, and the bars have individual colors, It's nice to know that I can make every bar clickable on this first image, but it doesn't help me much, because I don't want to stack the bars like that.
Basicly I want to achive result from second picture, but with ability to change color of each bar
@orzel1244
My bad... didn't read everything through thoroughly enough... What you are trying to achieve seems indeed not easily done in QML and it is a pity that the 3rd approach does not provide an easy way to play with thebarWidthproperty.For what it is worth, I played around and found you can close the gap between the series as follows:
- Use the
Qt.point(index, datavalue)approach for setting thevaluesof eachBarSet, - Let the first index of the next series coincide with the last index of the previous series
- Set
BarSeries::barWidthtoBarSeries::count
This however completely closes the gap between the bars, but the border of each bar gives a small separation effect.
Furthermore, you need to play with the x-axis limits, to get everything into view, which may lead to negative minimum x, which depends on the number of series you add etc...
For example:
    ChartView {
        title: "Bar series"
        anchors.fill: parent
        antialiasing: true

        BarSeries {
            id: mySeries
            barWidth: mySeries.count

            axisX: ValueAxis  {
                min: -2
                max: 10
            }

            BarSet {
                label: "Bob"
                values: [Qt.point(0, 2), Qt.point(1, 2), Qt.point(2, 3)];
                onClicked: console.debug("Bob clicked!" + index + " " + this.at(index))
            }

            BarSet {
                label: "Susan"
                values: [Qt.point(2, 4), Qt.point(3, 1), Qt.point(4, 7)];
                color: "black"
                onClicked: console.debug("Susan clicked!" + index + " " + this.at(index))
            }

            BarSet {
                label: "James"
                values: [Qt.point(4, 13), Qt.point(5, 5), Qt.point(6, 8)];
                onClicked: console.debug("James clicked!" + index + " " + this.at(index))
            }

            BarSet {
                label: "John"
                values: [Qt.point(6, 2), Qt.point(7, 7), Qt.point(8, 10)];
                onClicked: console.debug("John clicked!" + index + " " + this.at(index))
            }
        }
    }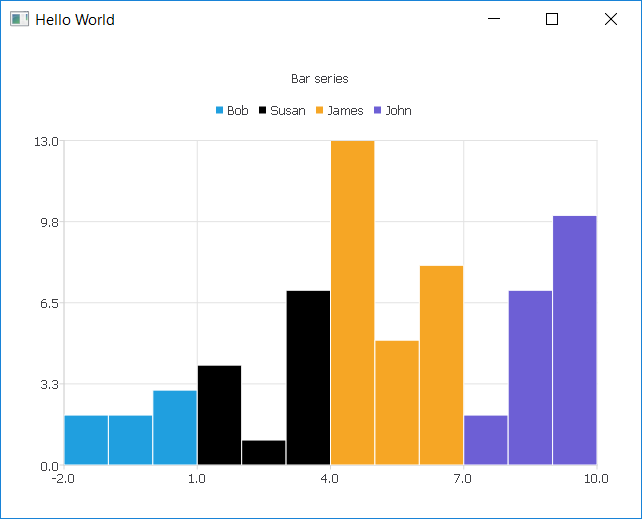
Not very practical all that, of course...
Otherwise, if you don't mind the C++ way, you could try
QCustomPlotwhich is very easy to include in your project, but somewhat difficult to get to learn.
https://www.qcustomplot.com/#include "qcustomplot.h" namespace Ui { class MainWindow; } class MainWindow : public QMainWindow { Q_OBJECT public slots: void onPlottableClick(QCPAbstractPlottable*,int,QMouseEvent*); public: explicit MainWindow(QWidget *parent = 0); ~MainWindow(); private: Ui::MainWindow *ui; QCustomPlot* m_customplot; };MainWindow::MainWindow(QWidget *parent) : QMainWindow(parent), ui(new Ui::MainWindow) { ui->setupUi(this); m_customplot = new QCustomPlot(this); m_customplot->setInteraction(QCP::iSelectPlottables, true); m_customplot->setInteraction(QCP::iSelectItems, true); m_customplot->setMinimumHeight(300); m_customplot->setMinimumWidth(400); QVector<double> datax1 = QVector<double>() << 1 << 2 << 3 << 4; QVector<double> datay1 = QVector<double>() << 0.6 << 0.5 << 0.3 << 0.15; QVector<double> datax2 = QVector<double>() << 1 << 2 << 3 << 4 << 5 << 6 << 7 << 8; QVector<double> datay2 = QVector<double>() << 0.0 << 0.0 << 0.0 << 0.0 << 0.3 << 0.28 << 0.2 << 0.1; QVector<double> datax3 = QVector<double>() << 1 << 2 << 3 << 4 << 5 << 6 << 7 << 8 << 9 << 10 << 11 << 12; QVector<double> datay3 = QVector<double>() << 0.0 << 0.0 << 0.0 << 0.0 << 0.0 << 0.0 << 0.0 << 0.0 <<0.33 << 0.31 << 0.27 << 0.13; double bwidth = 0.9; connect(m_customplot, SIGNAL(plottableClick(QCPAbstractPlottable*,int,QMouseEvent*)), this, SLOT(onPlottableClick(QCPAbstractPlottable*,int,QMouseEvent*))); QCPBars *bars = new QCPBars(m_customplot->xAxis, m_customplot->yAxis); bars->setSelectable(QCP::stSingleData); bars->setData(datax1, datay1); bars->setBrush(QColor(0, 0, 255, 50)); bars->setPen(QColor(0, 0, 255)); bars->setWidth(bwidth); bars->setWidthType(QCPBars::wtPlotCoords); bars = new QCPBars(m_customplot->xAxis, m_customplot->yAxis); bars->setSelectable(QCP::stSingleData); bars->setData(datax2, datay2); bars->setBrush(QColor(180, 00, 120, 50)); bars->setPen(QColor(180, 00, 120)); bars->setWidthType(QCPBars::wtPlotCoords); bars->setWidth(bwidth); bars = new QCPBars(m_customplot->xAxis, m_customplot->yAxis); bars->setSelectable(QCP::stSingleData); bars->setData(datax3, datay3); bars->setBrush(QColor(255, 154, 0, 50)); bars->setPen(QColor(255, 154, 0)); bars->setWidthType(QCPBars::wtPlotCoords); bars->setWidth(bwidth); m_customplot->xAxis->setRange(0.4, 13.5); m_customplot->yAxis->setRange(0, 0.7); } MainWindow::~MainWindow() { delete ui; } void MainWindow::onPlottableClick(QCPAbstractPlottable * plottable, int dataIndex, QMouseEvent * event) { qDebug() << "Clicked: " << dataIndex; }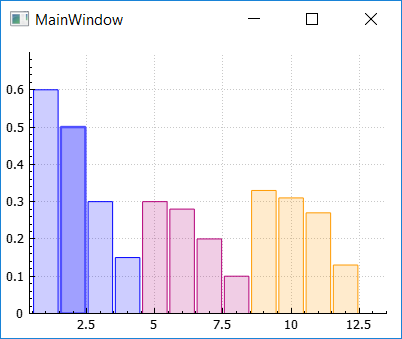
Although not easy to use,
QCustomPlotis highly customizable, and since the full source code is contained in only 2 files, you can even modify it on the fly according to your needs.If that works for you, then the next step would be to import the plot in QML, see e.g;
https://www.qcustomplot.com/index.php/support/forum/172Good luck.
- Use the
-
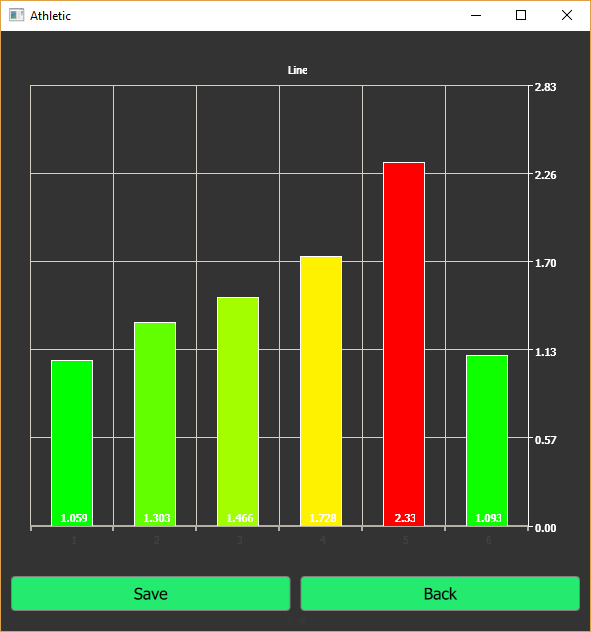
Even though this topic is old I want to share the solution which works for me with qt 5.14.
I had used the Qt Quick approach from orzel1244 , and by the way want to say thanks him. But afterwords, I managed to solve the "separete color for each bar" topic with
StackedBarSeriesand some modifications. Final result is bellow :StackedBarSeries { id: barSeries axisX: BarCategoryAxis { id: categoriesAxis } axisYRight: valueAxisY //customize it yourself labelsVisible: true labelsPosition: AbstractBarSeries.LabelsInsideBase } /////////////////////////// function setPoints(pointsTime) { barSeries.clear() categoriesAxis.clear() for (var i = 0; i < pointsTime.length; i++) { barSeries.append(i, [Qt.point(i, pointsTime[i])]) barSeries.at(i).color = calculateColor(...) categoriesAxis.categories.push(i+1) } }