Qt Creator: query on GraphsView and C++ model interaction:
-
Hello! I am new to Qt. I "simply" want to plot points in a x-y axis coordinate system by using the model-view concept.
Having attended some relevant Qt Academy on line courses, the idea is as follows:- C++ code to generate the points and stores them in a model that inherits from QAbstractListModel
- the GraphsView is in charge of plotting the x-axis and y-axis, retrieving the points from the C++ model and plotting them.
I have created my graphsview and my C++ model. The latter has a QScatterSeries and is correctly populated with points by the C++ code. (I have used the beging/endinsertRows, etc.). A nice x-y axis system is rendered on the screen, if I run my application, but no points from the model are rendered. (If I draw a point defined in the QML graphsview itself, that point is rendered as expected.)
I "believe" I have correctly exposed to QML). Debug logging shows that QML calls "int rowCount(.......)" but it does not call QVariant data(.......) to retrieve the points to plot: hence, no points are rendered.
I have found no example for this in the qt examples and qt academy courses (they deal with ListViews). Have I missed something? Has anyone got a code example I could have a look at to understand what I am doing wrong? Thanks.
Hi, and welcome!
@avio said in Qt Creator: query on GraphsView and C++ model interaction::
C++ code to generate the points and stores them in a model that inherits from QAbstractListModel
I would make your custom class inherit
QXYSeriesorQScatterSeriesinstead ofQAbstractListModel: https://doc.qt.io/qt-6/qxyseries.htmlThat way, you don't need to transfer data between your model and your graph. Simply add your custom series to the GraphsView, and your graph will automatically update whenever you call
append()/replace()/clear()on your series.If you need further assistance, please share your code.
-
@JKSH Many thanks, your help is very much appreciated. I have followed your advice: excellent result! I guess this approach should also work well for real-time data streaming from the C++ backend.
Before I close this conversation, I have a question, though, if I may, about the view-model approach I originally attempted. Surely, that must work too. Further debugging has shown that QML does call "QVariant data(const QModelIndex &index, int role) with a valid "index". Yet, "role" has got "random" values nowhere near the ones (257, 258) in the enum role belowclass List2dPlotModel : public QAbstractListModel { Q_OBJECT QML_ELEMENT public: enum Roles {XRole = Qt::UserRole + 1, YRole}; ...... private: QScatterSeries allPoints; }; QHash<int, QByteArray> roleNames() { QHash<int, QByteArray> roles; roles[XRole] = "x"; roles[YRole] = "y"; return roles; }I have seen examples of how this mapping (i.e., string-datum) works for "simple" class members (i.e., not array-like), but not one, so far, that deals with vectors or series. My "roles" also does not seem to make much sense to me, really, because, in principle, I guess the QML GraphsView should 1) be told it is dealing with "a" series (i.e., without knowing it's precisely my allPoints) of QPointfs, and 2) ask C++ for a point and 3) expect "QVariant Data(......)" to return a point. Series can indeed be added to the GraphsView. Parameter index"(.row() could do the job without using any "roles"? I am clearly missing something. Could you please give me at least a hint as to how to solve this QML-C++ mapping problem? Thanks.
@avio said in Qt Creator: query on GraphsView and C++ model interaction::
@JKSH Many thanks, your help is very much appreciated. I have followed your advice: excellent result! I guess this approach should also work well for real-time data streaming from the C++ backend.
Great to hear! You're welcome.
Before I close this conversation, I have a question, though, if I may, about the view-model approach I originally attempted. Surely, that must work too. Further debugging has shown that QML does call "QVariant data(const QModelIndex &index, int role) with a valid "index". Yet, "role" has got "random" values nowhere near the ones (257, 258) in the enum role below
We'll need to see your QML code (how you integrate your model with the GraphsView) to be able to say what went wrong. Seeing your implementation of List2dPlotModel::data() could also be helpful.
-
Hello @JKSH ! Here is the code...that shows my Qt inexperience. It displays the x-y system and the test point: nothing else. I have tried a few things, played with the Mapper and its values (the value of "series" below is definitely wrong, since I get an "unable to assign [undefined] to QXYSeries*) [some model-view "links" are clearly not in place], but all to no avail. Any suggestion will be appreciated. All I want to do is to use the view-model approach with QML asking the C++ backend for data. [I might have to divide this reply in segments in order to prevent "Akismet.com" to block the whole message as spam....]
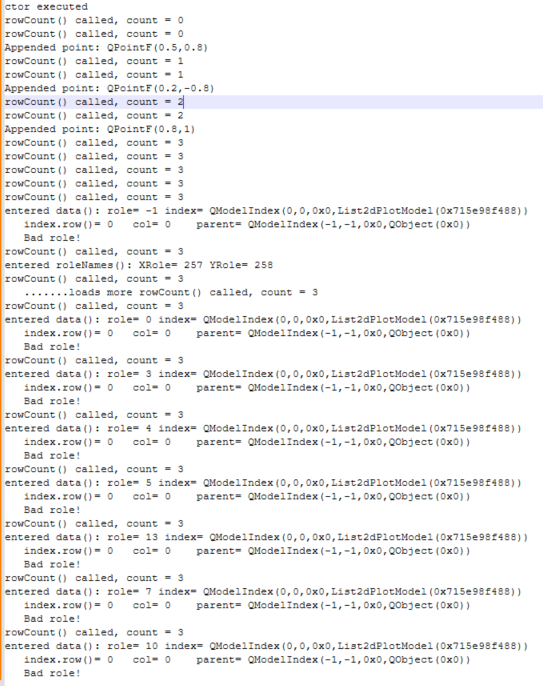
List2dPlotModel. h belowclass List2dPlotModel : public QAbstractListModel { Q_OBJECT public: enum Roles {XRole = Qt::UserRole + 1, YRole}; explicit List2dPlotModel(QObject* parent = nullptr); int rowCount(const QModelIndex& parent = QModelIndex()) const override { qDebug() << "rowCount() called, count =" << allPoints.count(); return allPoints.count(); } QVariant data(const QModelIndex &index, int role) const override { qDebug() << "entered data():" << "role=" << role << "index=" << index; if (!index.isValid()) { qDebug() << "modelindex NOT valid:"; return {}; } int idx = index.row(); qDebug() << " index.row()=" << idx << " col=" << index.column() << " parent=" << index.parent(); if (idx < 0 || idx>= allPoints.count()) { qDebug() << " Bad idx! "; return {}; } QPointF thePoint = allPoints.at(idx); if (role == XRole) return thePoint.x(); if (role == YRole) return thePoint.y(); qDebug() << " Bad role!"; return{}; } QHash<int, QByteArray> roleNames() const override { qDebug() << "entered roleNames(): XRole=" << XRole << "YRole=" << YRole; QHash<int, QByteArray> roles; roles[XRole] = "x"; roles[YRole] = "y"; return roles; } void appendPoint(qreal x, qreal y); private: //Series that contains the points to be rendered by a GraphsView. QScatterSeries allPoints; };list2dplotmodel.cpp below:
List2dPlotModel::List2dPlotModel(QObject *parent)
  : QAbstractListModel(parent)
{
    qDebug() << "ctor executed";
}

void List2dPlotModel::appendPoint(qreal x, qreal y)
{
    int rowIdx = allPoints.count();
    beginInsertRows(QModelIndex(), rowIdx, rowIdx);
    allPoints.append({x, y});
    endInsertRows();
    qDebug() << "Appended point:" << allPoints.at(rowIdx);
}
main.cpp below:
int main(int argc, char *argv[])
{
    QGuiApplication app(argc, argv);

    List2dPlotModel twoDPlotModel{};

    twoDPlotModel.appendPoint(0.5, 0.8);
    twoDPlotModel.appendPoint(0.2, -0.8);
    twoDPlotModel.appendPoint(0.8, 1);

    QAbstractItemModelTester(&twoDPlotModel,
        QAbstractItemModelTester::FailureReportingMode::Fatal,
        nullptr);

    QQmlApplicationEngine engine;
    QObject::connect(
        &engine,
        &QQmlApplicationEngine::objectCreationFailed,
        &app,
        []() { QCoreApplication::exit(-1); },
        Qt::QueuedConnection);
    engine.rootContext()->setContextProperty("plotModel", &twoDPlotModel);
    engine.loadFromModule("plot2dWithCppModel", "Main");

    return app.exec();
}
Main.qml below:
import QtQuick import QtGraphs import QtQml import QtQuick.Controls import plot2dWithCppModel Window { width: 640 height: 480 visible: true title: qsTr("Sine function") GraphsView { id: myView anchors.fill: parent axisX: ValueAxis { min: 0 max: 3 titleText: "x" gridVisible: true } axisY: ValueAxis { min: -1.5 max: 1.5 titleText: "sin(x)" gridVisible: true } Component { id: xyBufferMarker Rectangle { width: 6 height: 6 color: "red" border.color: "black" border.width: 1 radius: 3 } } ScatterSeries { id: mySeries visible: true color: "#00ff00" pointDelegate: xyBufferMarker XYPoint {x:0.5; y:0.8} // Rendering test. function logData() { console.log("data:" + myView.seriesList) //debug purposes. } } XYModelMapper { count: 0 model: plotModel series: plotModel.allPoints //Where is the model data abstraction, then?? xSection: 0 // Not too sure where I can find the definition of section....... ySection: 0 } } Button { text: "Click to see debug data" onClicked: { mySeries.logData(); } } } -
@JKSH Many thanks, your help is very much appreciated. I have followed your advice: excellent result! I guess this approach should also work well for real-time data streaming from the C++ backend.
Before I close this conversation, I have a question, though, if I may, about the view-model approach I originally attempted. Surely, that must work too. Further debugging has shown that QML does call "QVariant data(const QModelIndex &index, int role) with a valid "index". Yet, "role" has got "random" values nowhere near the ones (257, 258) in the enum role belowclass List2dPlotModel : public QAbstractListModel { Q_OBJECT QML_ELEMENT public: enum Roles {XRole = Qt::UserRole + 1, YRole}; ...... private: QScatterSeries allPoints; }; QHash<int, QByteArray> roleNames() { QHash<int, QByteArray> roles; roles[XRole] = "x"; roles[YRole] = "y"; return roles; }I have seen examples of how this mapping (i.e., string-datum) works for "simple" class members (i.e., not array-like), but not one, so far, that deals with vectors or series. My "roles" also does not seem to make much sense to me, really, because, in principle, I guess the QML GraphsView should 1) be told it is dealing with "a" series (i.e., without knowing it's precisely my allPoints) of QPointfs, and 2) ask C++ for a point and 3) expect "QVariant Data(......)" to return a point. Series can indeed be added to the GraphsView. Parameter index"(.row() could do the job without using any "roles"? I am clearly missing something. Could you please give me at least a hint as to how to solve this QML-C++ mapping problem? Thanks.
@avio said in Qt Creator: query on GraphsView and C++ model interaction::
Further debugging has shown that QML does call "QVariant data(const QModelIndex &index, int role) with a valid "index". Yet, "role" has got "random" values nowhere near the ones (257, 258) in the enum role below
Those roles are defined by the model-view framework, rather than random:
https://doc.qt.io/qt-6/qt.html#ItemDataRole-enum -
Hello @JKSH ! Here is the code...that shows my Qt inexperience. It displays the x-y system and the test point: nothing else. I have tried a few things, played with the Mapper and its values (the value of "series" below is definitely wrong, since I get an "unable to assign [undefined] to QXYSeries*) [some model-view "links" are clearly not in place], but all to no avail. Any suggestion will be appreciated. All I want to do is to use the view-model approach with QML asking the C++ backend for data. [I might have to divide this reply in segments in order to prevent "Akismet.com" to block the whole message as spam....]
List2dPlotModel. h belowclass List2dPlotModel : public QAbstractListModel { Q_OBJECT public: enum Roles {XRole = Qt::UserRole + 1, YRole}; explicit List2dPlotModel(QObject* parent = nullptr); int rowCount(const QModelIndex& parent = QModelIndex()) const override { qDebug() << "rowCount() called, count =" << allPoints.count(); return allPoints.count(); } QVariant data(const QModelIndex &index, int role) const override { qDebug() << "entered data():" << "role=" << role << "index=" << index; if (!index.isValid()) { qDebug() << "modelindex NOT valid:"; return {}; } int idx = index.row(); qDebug() << " index.row()=" << idx << " col=" << index.column() << " parent=" << index.parent(); if (idx < 0 || idx>= allPoints.count()) { qDebug() << " Bad idx! "; return {}; } QPointF thePoint = allPoints.at(idx); if (role == XRole) return thePoint.x(); if (role == YRole) return thePoint.y(); qDebug() << " Bad role!"; return{}; } QHash<int, QByteArray> roleNames() const override { qDebug() << "entered roleNames(): XRole=" << XRole << "YRole=" << YRole; QHash<int, QByteArray> roles; roles[XRole] = "x"; roles[YRole] = "y"; return roles; } void appendPoint(qreal x, qreal y); private: //Series that contains the points to be rendered by a GraphsView. QScatterSeries allPoints; };list2dplotmodel.cpp below:
List2dPlotModel::List2dPlotModel(QObject *parent)
  : QAbstractListModel(parent)
{
    qDebug() << "ctor executed";
}

void List2dPlotModel::appendPoint(qreal x, qreal y)
{
    int rowIdx = allPoints.count();
    beginInsertRows(QModelIndex(), rowIdx, rowIdx);
    allPoints.append({x, y});
    endInsertRows();
    qDebug() << "Appended point:" << allPoints.at(rowIdx);
}
main.cpp below:
int main(int argc, char *argv[])
{
    QGuiApplication app(argc, argv);

    List2dPlotModel twoDPlotModel{};

    twoDPlotModel.appendPoint(0.5, 0.8);
    twoDPlotModel.appendPoint(0.2, -0.8);
    twoDPlotModel.appendPoint(0.8, 1);

    QAbstractItemModelTester(&twoDPlotModel,
        QAbstractItemModelTester::FailureReportingMode::Fatal,
        nullptr);

    QQmlApplicationEngine engine;
    QObject::connect(
        &engine,
        &QQmlApplicationEngine::objectCreationFailed,
        &app,
        []() { QCoreApplication::exit(-1); },
        Qt::QueuedConnection);
    engine.rootContext()->setContextProperty("plotModel", &twoDPlotModel);
    engine.loadFromModule("plot2dWithCppModel", "Main");

    return app.exec();
}
Main.qml below:
import QtQuick import QtGraphs import QtQml import QtQuick.Controls import plot2dWithCppModel Window { width: 640 height: 480 visible: true title: qsTr("Sine function") GraphsView { id: myView anchors.fill: parent axisX: ValueAxis { min: 0 max: 3 titleText: "x" gridVisible: true } axisY: ValueAxis { min: -1.5 max: 1.5 titleText: "sin(x)" gridVisible: true } Component { id: xyBufferMarker Rectangle { width: 6 height: 6 color: "red" border.color: "black" border.width: 1 radius: 3 } } ScatterSeries { id: mySeries visible: true color: "#00ff00" pointDelegate: xyBufferMarker XYPoint {x:0.5; y:0.8} // Rendering test. function logData() { console.log("data:" + myView.seriesList) //debug purposes. } } XYModelMapper { count: 0 model: plotModel series: plotModel.allPoints //Where is the model data abstraction, then?? xSection: 0 // Not too sure where I can find the definition of section....... ySection: 0 } } Button { text: "Click to see debug data" onClicked: { mySeries.logData(); } } }@avio said in Qt Creator: query on GraphsView and C++ model interaction::
series: plotModel.allPoints //Where is the model data abstraction, then??XYModelMapper reads data from a source table model and writes it to a destination/target XYSeries.
XYModelMapper.modelis the source, andXYModelMapper.seriesis the destination.So, what you want is
series: mySeriesxSection: 0 // Not too sure where I can find the definition of section.......It's a bit obscure, but when talking about Qt models, "section" refers to "row" or "column" depending on the orientation. See https://doc.qt.io/qt-6/qabstractitemmodel.html#headerData for example.
For a quick sanity check: Ensure that your model's data can be displayed by a
TableView(see https://doc.qt.io/qt-6/qml-qtquick-tableview.html#example-usage ). If TableView can't see your data, thenXYModelMappercan't either.if (role == XRole) return thePoint.x(); if (role == YRole) return thePoint.y();XYModelMapperoperates on columns (sections), so you don't need to define any custom roles. Just use the defaultQt::DisplayRole. What you want is a setup like this:- Column 0 gives x value
- Column 1 gives y value
- Row N corresponds to allPoints.at(N)
But at the end of the day, your data flow is now
Data -> inner QScatterSeries -> List2dPlotModel -> XYModelMapper -> outer QScatterSeries -> GraphsViewwhich forms a Rube Goldberg machine.What you want is
Data -> QScatterSeries -> GraphsView -
@avio said in Qt Creator: query on GraphsView and C++ model interaction::
series: plotModel.allPoints //Where is the model data abstraction, then??XYModelMapper reads data from a source table model and writes it to a destination/target XYSeries.
XYModelMapper.modelis the source, andXYModelMapper.seriesis the destination.So, what you want is
series: mySeriesxSection: 0 // Not too sure where I can find the definition of section.......It's a bit obscure, but when talking about Qt models, "section" refers to "row" or "column" depending on the orientation. See https://doc.qt.io/qt-6/qabstractitemmodel.html#headerData for example.
For a quick sanity check: Ensure that your model's data can be displayed by a
TableView(see https://doc.qt.io/qt-6/qml-qtquick-tableview.html#example-usage ). If TableView can't see your data, thenXYModelMappercan't either.if (role == XRole) return thePoint.x(); if (role == YRole) return thePoint.y();XYModelMapperoperates on columns (sections), so you don't need to define any custom roles. Just use the defaultQt::DisplayRole. What you want is a setup like this:- Column 0 gives x value
- Column 1 gives y value
- Row N corresponds to allPoints.at(N)
But at the end of the day, your data flow is now
Data -> inner QScatterSeries -> List2dPlotModel -> XYModelMapper -> outer QScatterSeries -> GraphsViewwhich forms a Rube Goldberg machine.What you want is
Data -> QScatterSeries -> GraphsView -
A avio has marked this topic as solved