Skip to content
  • Categories
  • Recent
  • Tags
  • Popular
  • Users
  • Groups
  • Search
  • Get Qt Extensions
  • Unsolved
Collapse
Brand Logo
  1. Home
  2. Qt Development
  3. QML and Qt Quick
  4. QML chart has border space instead of filling whole parent
Qt 6.11 is out! See what's new in the release blog

QML chart has border space instead of filling whole parent

Scheduled Pinned Locked Moved Unsolved QML and Qt Quick
7 Posts 3 Posters 1.2k Views 2 Watching
  • Oldest to Newest
  • Newest to Oldest
  • Most Votes
Reply
  • Reply as topic
Log in to reply
This topic has been deleted. Only users with topic management privileges can see it.
  • E Offline
    E Offline
    EqiupmentConnected
    wrote on last edited by
    #1

    I want this QML chartview to fill the entire rectangle, but it has a white border area. How can I make it fill the entire space? I've used it in other programs where it fills the whole thing by default, I can't figure out what causes it to have a border in this case.
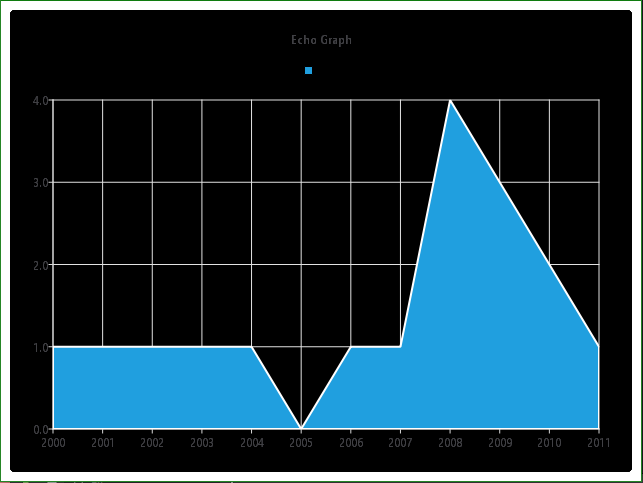
    alt text

    import QtQuick 2.15
    import QtCharts 2.15
    import QtQuick.Controls
    
    Window
    {
        id: window1
    
        visible: true
        width: 640
        height: 480
    
        Rectangle
        {
            id: echoChart
    
            anchors.fill:parent
    
            ChartView
            {
                title: "Echo Graph"
                anchors.fill: parent
                antialiasing: true
                backgroundColor: "black"
    
                ValuesAxis
                {
                    id: valueAxis
                    min: 2000
                    max: 2011
                    tickCount: 12
                    labelFormat: "%.0f"
                }
    
                AreaSeries
                {
                    axisX: valueAxis
                    upperSeries: LineSeries
                    {
                        XYPoint { x: 2000; y: 1 }
                        XYPoint { x: 2001; y: 1 }
                        XYPoint { x: 2002; y: 1 }
                        XYPoint { x: 2003; y: 1 }
                        XYPoint { x: 2004; y: 1 }
                        XYPoint { x: 2005; y: 0 }
                        XYPoint { x: 2006; y: 1 }
                        XYPoint { x: 2007; y: 1 }
                        XYPoint { x: 2008; y: 4 }
                        XYPoint { x: 2009; y: 3 }
                        XYPoint { x: 2010; y: 2 }
                        XYPoint { x: 2011; y: 1 }
                    }
                }
            }
        }
    }
    
    
    1 Reply Last reply
    0
    • sierdzioS Offline
      sierdzioS Offline
      sierdzio
      Moderators
      wrote on last edited by
      #2

      Try setting margins property, maybe they are not zero by default: https://doc.qt.io/qt-6/qml-qtcharts-chartview.html#margins-prop

      (Z(:^

      mzimmersM 1 Reply Last reply
      2
      • sierdzioS sierdzio

        Try setting margins property, maybe they are not zero by default: https://doc.qt.io/qt-6/qml-qtcharts-chartview.html#margins-prop

        mzimmersM Offline
        mzimmersM Offline
        mzimmers
        wrote on last edited by
        #3

        @sierdzio you are indeed correct:

         ChartView {
            id: chartView
            Component.onCompleted: {
                console.log(chartView.margins.left)
                console.log(chartView.margins.right)
                console.log(chartView.margins.top)
                console.log(chartView.margins.bottom)
        

        produces:

        14:20:16: Starting Qt_projects\chartview\build\Desktop_Qt_6_5_3_MinGW_64_bit-Debug\appchartview.exe...
        qml: 20
        qml: 20
        qml: 20
        qml: 20
        
        1 Reply Last reply
        0
        • sierdzioS Offline
          sierdzioS Offline
          sierdzio
          Moderators
          wrote on last edited by
          #4

          That's weird! But at least it makes the issue clear.

          (Z(:^

          1 Reply Last reply
          0
          • E Offline
            E Offline
            EqiupmentConnected
            wrote on last edited by
            #5

            How can I change the margin value? I tried

                    margins.left: 0
                    margins.right: 0
                    margins.bottom: 0
                    margins.top: 0
            

            It doesn't change it, also making the numbers bigger does nothing as well. I did find a hack to solve it though, set the rectangle color to be the same as the chart will make it appear as if there is no border.

            1 Reply Last reply
            0
            • mzimmersM Offline
              mzimmersM Offline
              mzimmers
              wrote on last edited by
              #6

              Hmm...my experimentation seemed to produce the same results. This might be worth reporting as a bug.

              1 Reply Last reply
              0
              • sierdzioS Offline
                sierdzioS Offline
                sierdzio
                Moderators
                wrote on last edited by
                #7

                This might be a bug or "feature" of this component, then. You can file a report about it on Qt bug tracker.

                (Z(:^

                1 Reply Last reply
                0

                • Login

                • Login or register to search.
                • First post
                  Last post
                0
                • Categories
                • Recent
                • Tags
                • Popular
                • Users
                • Groups
                • Search
                • Get Qt Extensions
                • Unsolved