
impossible to change x axis format
-
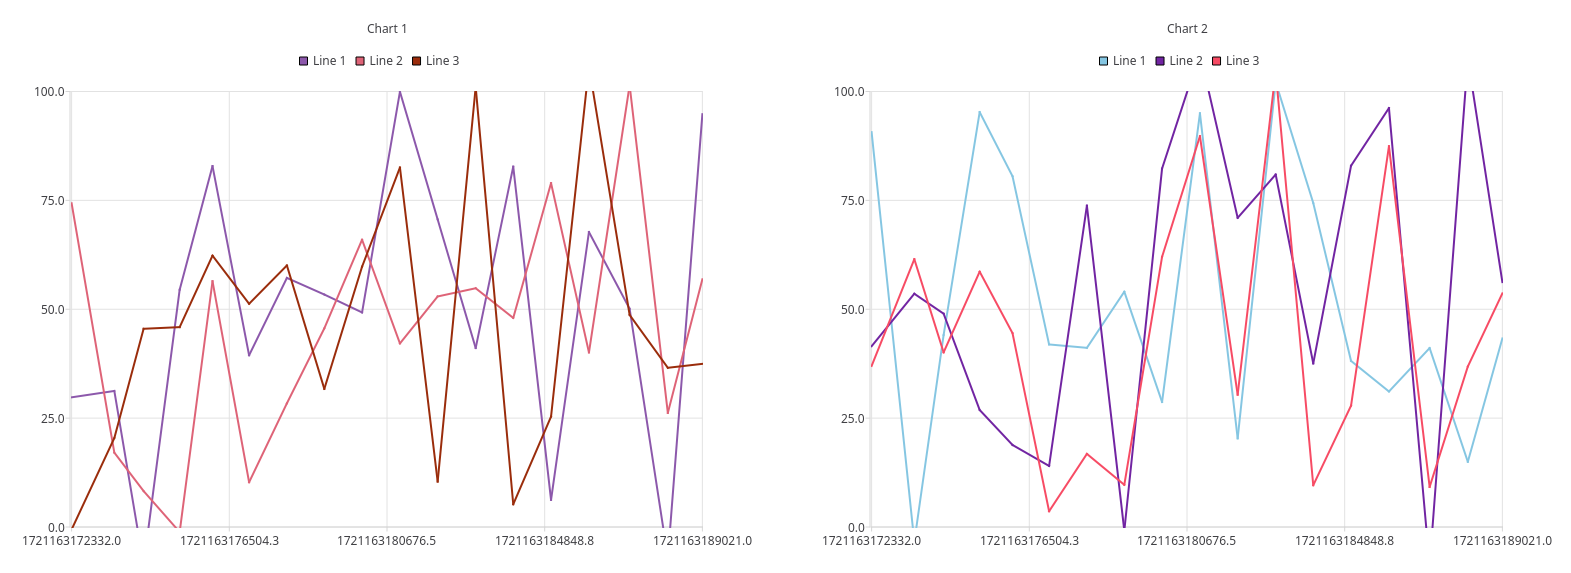
on x axis I am using
DateTimeAxis but it still shows me epoch time in ms. i didnt find me to show in hh mm ss.import QtQuick 2.15 import QtQuick.Window 2.15 import QtCharts 2.15 import QtMultimedia Window { width: 1600 height: 600 visible: true title: qsTr("Dynamic Charts") Grid { id: chartGrid anchors.fill: parent columns: 2 spacing: 10 // Charts will be dynamically added here } SoundEffect { id: alertSound source: "qrc:/sounds/alert.wav" } Component.onCompleted: { updateCharts() } Connections { target: chartModel function onChartDataChanged() { updateCharts() } function onOutOfRangeAlert(chartName, lineName) { console.log("Alert: " + chartName + " - " + lineName + " is out of range!") alertSound.play() } } function updateCharts() { let chartData = chartModel.getChartData() let currentTime = new Date() // Ensure we have a ChartView for each chart while (chartViews.length < chartData.length) { let newChartView = chartViewComponent.createObject(chartGrid) chartViews.push(newChartView) } // Remove excess ChartViews while (chartViews.length > chartData.length) { let excessChart = chartViews.pop() excessChart.destroy() } // Update each chart for (let chartIndex = 0; chartIndex < chartData.length; chartIndex++) { let chart = chartData[chartIndex] let chartView = chartViews[chartIndex] chartView.title = chart.name for (let lineIndex = 0; lineIndex < chart.lines.length; lineIndex++) { let line = chart.lines[lineIndex] let seriesName = line.name let series = findOrCreateSeries(chartView, seriesName) series.append(currentTime, line.currentValue) // Update x-axis range let minTime = series.at(0).x chartView.axes[0].min = minTime chartView.axes[0].max = currentTime chartView.axes[0].format = "HH:mm:ss" chartView.axes[1].min = 0 chartView.axes[1].max = 100 // Flash effect for out of range values if (line.currentValue < line.min || line.currentValue > line.max) { flashSeries(series) } } // Remove series that are no longer in the data removeStaleSeries(chartView, chart.lines) } } function findOrCreateSeries(chartView, seriesName) { for (let i = 0; i < chartView.count; i++) { if (chartView.series(i).name === seriesName) { return chartView.series(i) } } // If not found, create new series let series = chartView.createSeries(ChartView.SeriesTypeLine, seriesName) series.color = Qt.rgba(Math.random(), Math.random(), Math.random(), 1) return series } function flashSeries(series) { if (!series.flashAnimation) { series.flashAnimation = Qt.createQmlObject(' import QtQuick 2.15 SequentialAnimation { loops: Animation.Infinite ColorAnimation { target: series; property: "color"; to: "yellow"; duration: 500 } ColorAnimation { target: series; property: "color"; to: series.color; duration: 500 } } ', series) series.flashAnimation.start() } } function removeStaleSeries(chartView, lines) { let validSeriesNames = new Set(lines.map(line => line.name)) for (let i = chartView.count - 1; i >= 0; i--) { let series = chartView.series(i) if (!validSeriesNames.has(series.name)) { chartView.removeSeries(series) } } } property var chartViews: [] Component { id: chartViewComponent ChartView { width: chartGrid.width / chartGrid.columns - chartGrid.spacing height: chartGrid.height / Math.ceil(chartModel.getChartData().length / chartGrid.columns) - chartGrid.spacing antialiasing: true DateTimeAxis { id: axisX format: "HH:mm:ss" tickCount: 100 min: new Date() } ValueAxis { id: axisY min: 0 max: 1000 } } } }