
Displaying bool values as "boxes" in a QChart
-
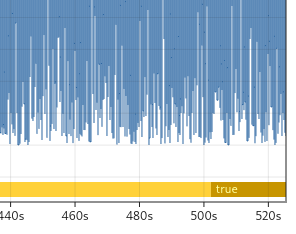
I'm looking to be able to display a bool value as a box on a chart, i.e. red for false, green for true. I've thought of using a QAreaSeries, but this would look kinda bad so I decided against it.
Here's an example of what I'm looking for (from a non-Qt application):
-
QScatterSeries might be what you're looking for.
https://doc.qt.io/qt-6/qscatterseries.html -
S swurl has marked this topic as solved on