The callout example was referenced, but the desired result could not be derived.
-
First of all, I am sorry that the translation is not smooth.
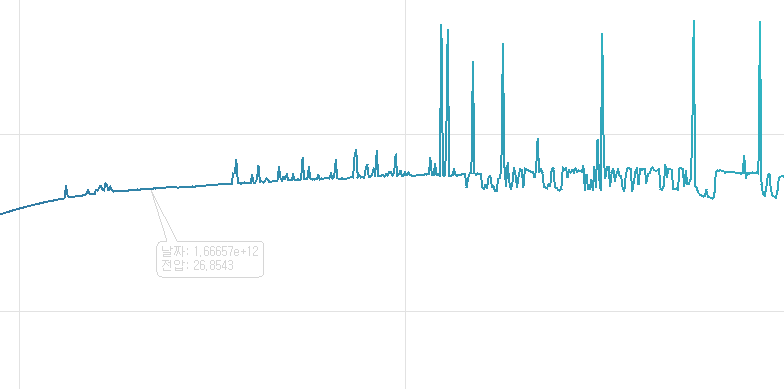
I want to express Xvalue and Yvalue in tooltip state at specific coordinates in linechart
I tried it because I thought the Callout example could be implemented similarly.
However, the Callout example is not a DB-linked approach
The point could only be applied to qreal.
I'm drawing a linechart that is linked to the database.
Currently, xvalue is using the Qdatetime class
yvalue is using qreal.
Callout Full Example Code.
callout.cpp
#include "callout.h"
#include <QtGui/QPainter>
#include <QtGui/QFontMetrics>
#include <QtWidgets/QGraphicsSceneMouseEvent>
#include <QtGui/QMouseEvent>
#include <QtCharts/QChart>

Callout::Callout(QChart *chart):
    QGraphicsItem (chart),
    chart(chart)
{

}

QRectF Callout::boundingRect() const
{
    QPointF anchor = mapFromParent(chart->mapToValue(m_anchor));
    QRectF rect;
    rect.setLeft(qMin(m_rect.left(), anchor.x()));
    rect.setRight(qMax(m_rect.right(), anchor.x()));
    rect.setTop(qMin(m_rect.top(), anchor.y()));
    rect.setBottom(qMax(m_rect.bottom(), anchor.y()));
    return rect;
}
void Callout::paint(QPainter *painter, const QStyleOptionGraphicsItem *option, QWidget *widget)
{
    Q_UNUSED(option)
    Q_UNUSED(widget)
    QPainterPath path;
    path.addRoundedRect(m_rect, 5, 5);

    QPointF anchor = mapFromParent(chart->mapToPosition(m_anchor));
    if (!m_rect.contains(anchor)) {
        QPointF point1, point2;

        // establish the position of the anchor point in relation to m_rect
        bool above = anchor.y() <= m_rect.top();
        bool aboveCenter = anchor.y() > m_rect.top() && anchor.y() <= m_rect.center().y();
        bool belowCenter = anchor.y() > m_rect.center().y() && anchor.y() <= m_rect.bottom();
        bool below = anchor.y() > m_rect.bottom();

        bool onLeft = anchor.x() <= m_rect.left();
        bool leftOfCenter = anchor.x() > m_rect.left() && anchor.x() <= m_rect.center().x();
        bool rightOfCenter = anchor.x() > m_rect.center().x() && anchor.x() <= m_rect.right();
        bool onRight = anchor.x() > m_rect.right();

        // get the nearest m_rect corner.
        qreal x = (onRight + rightOfCenter) * m_rect.width();
        qreal y = (below + belowCenter) * m_rect.height();
        bool cornerCase = (above && onLeft) || (above && onRight) || (below && onLeft) || (below && onRight);
        bool vertical = qAbs(anchor.x() - x) > qAbs(anchor.y() - y);

        qreal x1 = x + leftOfCenter * 10 - rightOfCenter * 20 + cornerCase * !vertical * (onLeft * 10 - onRight * 20);
        qreal y1 = y + aboveCenter * 10 - belowCenter * 20 + cornerCase * vertical * (above * 10 - below * 20);;
        point1.setX(x1);
        point1.setY(y1);

        qreal x2 = x + leftOfCenter * 20 - rightOfCenter * 10 + cornerCase * !vertical * (onLeft * 20 - onRight * 10);;
        qreal y2 = y + aboveCenter * 20 - belowCenter * 10 + cornerCase * vertical * (above * 20 - below * 10);;
        point2.setX(x2);
        point2.setY(y2);

        path.moveTo(point1);
        path.lineTo(anchor);
        path.lineTo(point2);
        path = path.simplified();
    }
    painter->setBrush(QColor(255, 255, 255));
    painter->drawPath(path);
    painter->drawText(m_textRect, m_text);
}

void Callout::mousePressEvent(QGraphicsSceneMouseEvent *event)
{
    event->setAccepted(true);
}

void Callout::mouseMoveEvent(QGraphicsSceneMouseEvent *event)
{
    if (event->buttons() & Qt::LeftButton){
        setPos(mapToParent(event->pos() - event->buttonDownPos(Qt::LeftButton)));
        event->setAccepted(true);
    } else {
        event->setAccepted(false);
    }
}

void Callout::setText(const QString &text)
{
    m_text = text;
    QFontMetrics metrics(m_font);
    m_textRect = metrics.boundingRect(QRect(0, 0, 150, 150), Qt::AlignLeft, m_text);
    m_textRect.translate(5, 5);
    prepareGeometryChange();
    m_rect = m_textRect.adjusted(-5, -5, 5, 5);
}

void Callout::setAnchor(QPointF point)
{
    m_anchor = point;
}

void Callout::updateGeometry()
{
    prepareGeometryChange();
    setPos(chart->mapToPosition(m_anchor) + QPoint(10, -50));
}
callout.h
#ifndef CALLOUT_H
#define CALLOUT_H

#include <QtCharts/QChartGlobal>
#include <QtWidgets/QGraphicsItem>
#include <QtGui/QFont>

QT_BEGIN_NAMESPACE
class QGraphicsSceneMouseEvent;
QT_END_NAMESPACE

QT_CHARTS_BEGIN_NAMESPACE
class QChart;
QT_CHARTS_END_NAMESPACE

QT_CHARTS_USE_NAMESPACE

class Callout : public QGraphicsItem
{
public:
    Callout(QChart *parent);

    void setText(const QString &text);
    void setAnchor(QPointF point);
    void updateGeometry();

    QRectF boundingRect() const;
    void paint(QPainter *painter, const QStyleOptionGraphicsItem *option, QWidget *widget);

protected:
    void mousePressEvent(QGraphicsSceneMouseEvent *event);
    void mouseMoveEvent(QGraphicsSceneMouseEvent *evnet);

private:
    QString m_text;
    QRectF m_textRect;
    QRectF m_rect;
    QPointF m_anchor;
    QFont m_font;
    QChart *chart;
};

#endif // CALLOUT_H
And the tooltip from the linechart code
Code used.void linechart::tooltip(QPointF point,bool state) { if (m_tooltip == 0) m_tooltip = new Callout(m_chart); if (state) { m_tooltip->setText(QString("날짜: %1 \n전압: %2 ").arg(point.x()).arg(point.y())); m_tooltip->setAnchor(point); m_tooltip->setZValue(11); m_tooltip->updateGeometry(); m_tooltip->show(); } else { m_tooltip->hide(); } }It's blocked at the point.
How can I put the xvalue date value?
This is the current chart picture.