Real-time QLineChart to QAreaChart
-
Hello,
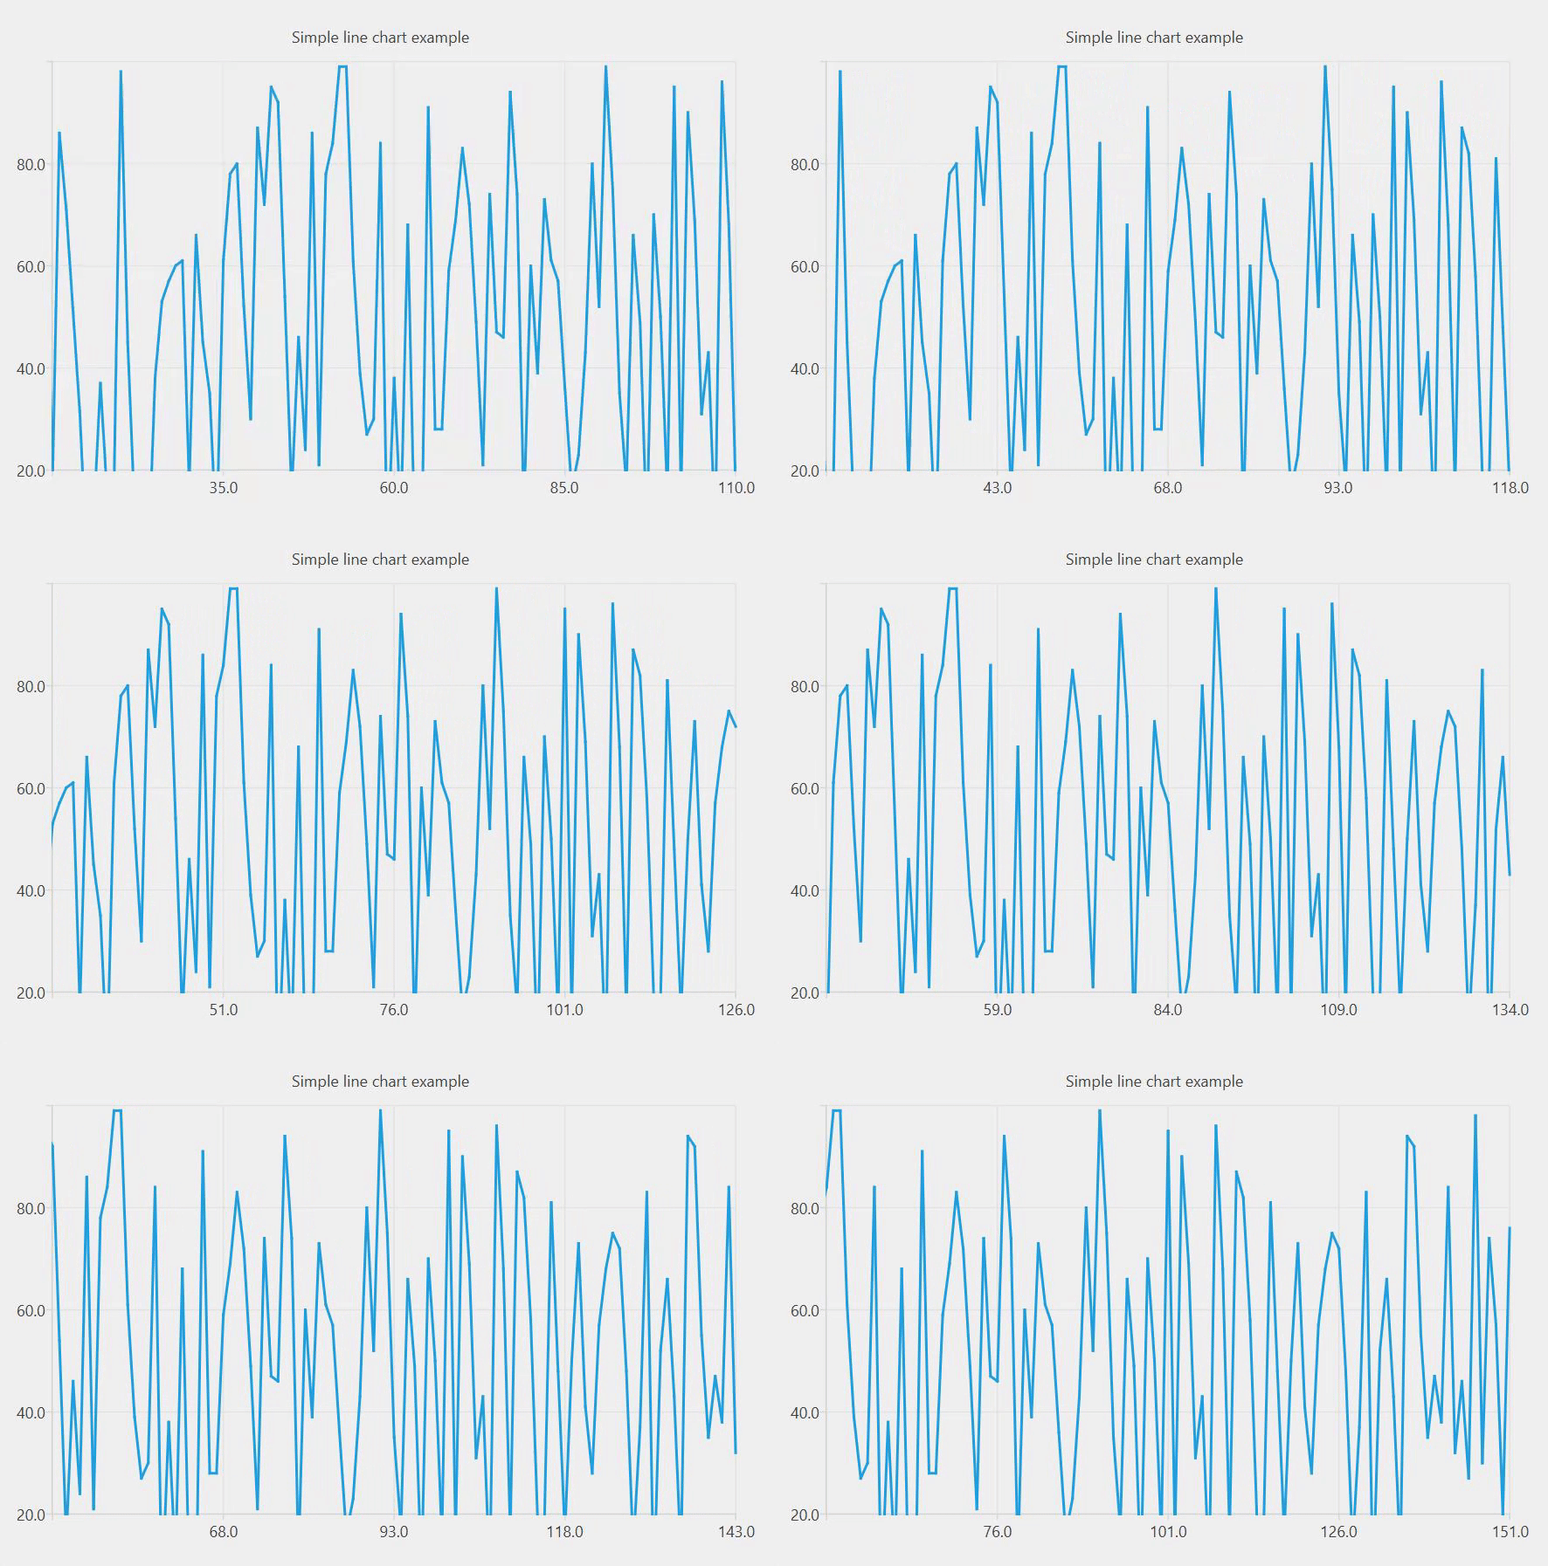
I am currently trying to convert my real-time line chart into an area chart. The only reason I would like to do this is so I can "fill in" a shade on the series brushes.
Current chart:

Chart type I would like:

I tried following the tutorial here. However, the chart would remain blank. Would anyone be able to point me in the right direction?
I have made a minimal version of the program that uses a timer instead of a thread. I have tried creating a QAreaSeries, then pointing two QLinesSeries to the QAreaSeries, but the chart remained blank.
Also, a general question about the charts; do I have to delete any of the old records that are no longer in the view port, or do they get garbage collected automatically (if I keep appending data to the existing series - will it ever overflow)?
Is "chart->axisX()->setRange(counter-100,counter);" the best way of "moving" the graph viewport, or is there a better way of doing it (I understand that axisX() is deprecated)?
QT       += core gui charts

greaterThan(QT_MAJOR_VERSION, 4): QT += widgets

CONFIG += c++11

# You can make your code fail to compile if it uses deprecated APIs.
# In order to do so, uncomment the following line.
#DEFINES += QT_DISABLE_DEPRECATED_BEFORE=0x060000    # disables all the APIs deprecated before Qt 6.0.0

SOURCES += \
    main.cpp \
    mainwindow.cpp

HEADERS += \
    mainwindow.h

FORMS += \
    mainwindow.ui

# Default rules for deployment.
qnx: target.path = /tmp/$${TARGET}/bin
else: unix:!android: target.path = /opt/$${TARGET}/bin
!isEmpty(target.path): INSTALLS += target
mainwindow.h
#ifndef MAINWINDOW_H
#define MAINWINDOW_H

#include <QMainWindow>

#include <QDebug>
#include <QtCharts>

#include <QRandomGenerator>

QT_BEGIN_NAMESPACE
namespace Ui { class MainWindow; }
QT_END_NAMESPACE

class MainWindow : public QMainWindow
{
    Q_OBJECT

public:
    MainWindow(QWidget *parent = nullptr);
    ~MainWindow();

private slots:

private:
    Ui::MainWindow *ui;
    int timerId;
    int counter = 0;
    QLineSeries *series = new QLineSeries();
    QChart *chart = new QChart();

protected:
    void timerEvent(QTimerEvent *event);
};
#endif // MAINWINDOW_H
mainwindow.cpp
#include "mainwindow.h"
#include "ui_mainwindow.h"

MainWindow::MainWindow(QWidget *parent)
    : QMainWindow(parent)
    , ui(new Ui::MainWindow)
{
    ui->setupUi(this);

    chart->legend()->hide();
    chart->setBackgroundBrush(QBrush(QColor("transparent")));
    chart->addSeries(series);
    chart->createDefaultAxes();
    chart->setTitle("Simple line chart example");

    QChartView *chartView = new QChartView(chart);
    chartView->setRenderHint(QPainter::Antialiasing);

    chart->axisY()->setRange(20,100);
    ui->verticalLayout->addWidget(chartView);

    timerId = startTimer(1000);
}

MainWindow::~MainWindow()
{
    delete ui;
}

void MainWindow::timerEvent(QTimerEvent *event)
{
    qDebug() << "Update... " << counter << ".";

    int random = ((100 - 1) * ((float)rand() / RAND_MAX)) + 1;
    qDebug() << "Random: " << random << ".";

    series->append(counter, random);

    chart->axisX()->setRange(counter-100,counter);

    counter++;
}
mainwindow.ui
<?xml version="1.0" encoding="UTF-8"?>
<ui version="4.0">
 <class>MainWindow</class>
 <widget class="QMainWindow" name="MainWindow">
  <property name="geometry">
   <rect>
    <x>0</x>
    <y>0</y>
    <width>642</width>
    <height>450</height>
   </rect>
  </property>
  <property name="windowTitle">
   <string>MainWindow</string>
  </property>
  <widget class="QWidget" name="centralwidget">
   <widget class="QWidget" name="verticalLayoutWidget">
    <property name="geometry">
     <rect>
      <x>0</x>
      <y>0</y>
      <width>631</width>
      <height>421</height>
     </rect>
    </property>
    <layout class="QVBoxLayout" name="verticalLayout"/>
   </widget>
  </widget>
  <widget class="QStatusBar" name="statusbar"/>
 </widget>
 <resources/>
 <connections/>
</ui>
main.cpp
#include "mainwindow.h"

#include <QApplication>

int main(int argc, char *argv[])
{
    QApplication a(argc, argv);
    MainWindow w;
    w.show();
    return a.exec();
}
Any help would be appreciated.
Thanks,
Ryan.
