
16:24:37: The program has unexpectedly finished.
-
Using the debugger - with thoughtfully set breakpoints - is usually the best bet to quickly find and eliminate a problem. However, I often make extensive use of debugging output, especially if the problem is hard to reproduce. That way I can narrow down the whereabouts of the origin.
-
This post is deleted!
@AnneRanch
If you are lucky you will not have to "step thru". Simply run the program from the debugger. Hopefully when the "crash" happens it will stop and the debugger will will kick in. Then all you have to do is examine the stack trace window and trace back to a line in your code which caused the problem. Without needing to place breakpoints or do any stepping. -
Well - after enabling "stop when abort..."
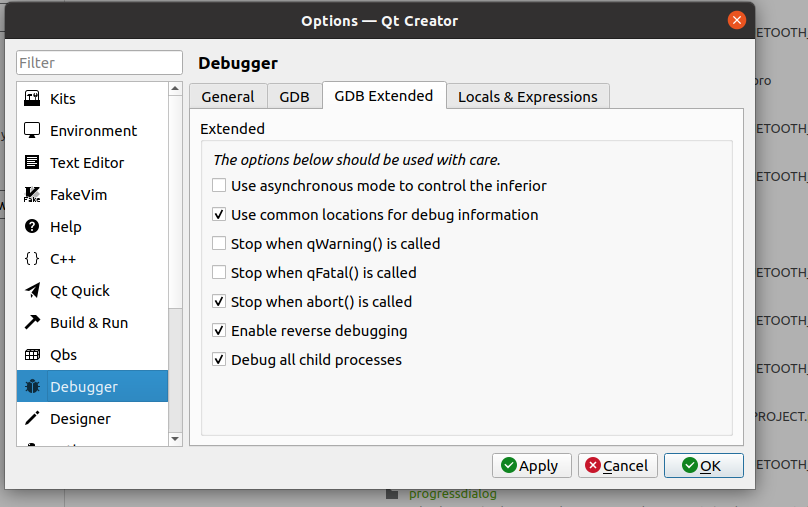
and removing all breakpoints up to suspected problem and running "debug" I am getting this

which really does not help much to identify the problem area.
I guess I will experiment more with the "GDB extended" options.Actually wonder what "reverse debugging" does.
-
Well - after enabling "stop when abort..."
and removing all breakpoints up to suspected problem and running "debug" I am getting this
which really does not help much to identify the problem area.
I guess I will experiment more with the "GDB extended" options.Actually wonder what "reverse debugging" does.
@AnneRanch said in 16:24:37: The program has unexpectedly finished.:
which really does not help much to identify the problem area.
Yes, it does. I you read my answer and act on it
Then all you have to do is examine the stack trace window and trace back to a line in your code which caused the problem.
-
Well - after enabling "stop when abort..."
and removing all breakpoints up to suspected problem and running "debug" I am getting this
which really does not help much to identify the problem area.
I guess I will experiment more with the "GDB extended" options.Actually wonder what "reverse debugging" does.