
How to improve anti-aliasing?
-
Hi! I am trying to make a line plot in
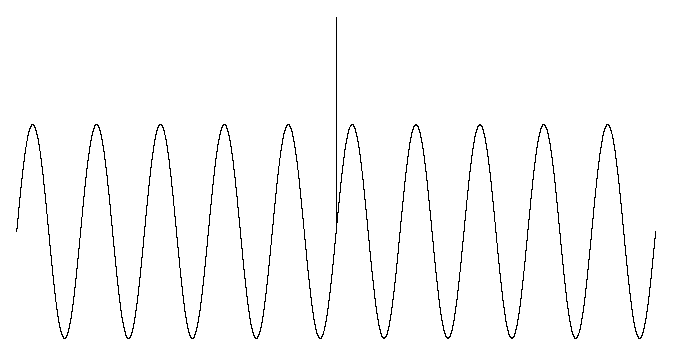
QWidget. To obtain the line plot I map the X and Y points of my data point to its correct position inQWidgetand then draw a line usingQPainter'sdrawLine()function connecting previous point to the current point. The data points are huge (in tens or hundreds of thousands). What I get is the following:Aliased:
Anti-alised:
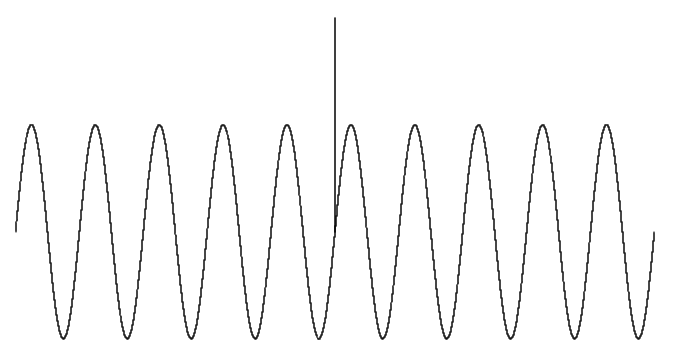
In both of the above examples, the pen width is 1 and 100,000 data points are plotted in a sine wave with frequency 10 and amplitude 1. There is one data point at the center which is of value 2 which stands out, this is because I need to accommodate spikes in my plot. Since I need to accommodate spikes, I cannot use any kind of algorithm based smoothing (such as using Bezier Curves). This leaves me with options such as anti-alising and painting tricks, but as you can see above anti-alising doesn't produce a good result. I have tried the following as well:- Using
doubleprecision instead ofintegerprecision for mapping the X and Y data points to it's correct position onQWidget. This significantly increases the calculation time but the final plot looks the same as if I would have done the calculation with integer precision. - Painting my line plot on a
QImage4 times the size of the plot area, then applying anti-alising to it and then shrink it to correct size. This also increases calculation time significantly but the final plot again looks the same as above.
I don't think using OpenGL Paint Engine is a good idea as explained in this QOpenGLPaintDevice Class document. Is there any way I can improve the rendering of my line plots?
- Using
-
Hi! I am trying to make a line plot in
QWidget. To obtain the line plot I map the X and Y points of my data point to its correct position inQWidgetand then draw a line usingQPainter'sdrawLine()function connecting previous point to the current point. The data points are huge (in tens or hundreds of thousands). What I get is the following:Aliased:
Anti-alised:
In both of the above examples, the pen width is 1 and 100,000 data points are plotted in a sine wave with frequency 10 and amplitude 1. There is one data point at the center which is of value 2 which stands out, this is because I need to accommodate spikes in my plot. Since I need to accommodate spikes, I cannot use any kind of algorithm based smoothing (such as using Bezier Curves). This leaves me with options such as anti-alising and painting tricks, but as you can see above anti-alising doesn't produce a good result. I have tried the following as well:- Using
doubleprecision instead ofintegerprecision for mapping the X and Y data points to it's correct position onQWidget. This significantly increases the calculation time but the final plot looks the same as if I would have done the calculation with integer precision. - Painting my line plot on a
QImage4 times the size of the plot area, then applying anti-alising to it and then shrink it to correct size. This also increases calculation time significantly but the final plot again looks the same as above.
I don't think using OpenGL Paint Engine is a good idea as explained in this QOpenGLPaintDevice Class document. Is there any way I can improve the rendering of my line plots?
@CJha Found a solution. This works quite fast, 100k data points plotted in around 15 - 20 ms.
void mainWindow::paintEvent(QPaintEvent *event)
{
    /* Constructing Line Plot */
    double numOfPoints{100000}; // Data Length is 100 Thousand
    QVector<double> data; // Data Vector of 100 Thousand
    for(int ii = 0; ii < numOfPoints; ++ii)
    {
        // Sine Wave: Amplitude = 1; Frequency = 10
        data << (1 * sin (2 * M_PI * 5 * ii/numOfPoints));
    }
    int midPoint = round(numOfPoints/2);
    data[midPoint] = 2; // Adding a single point of amplitude 2 at 50 thousandth data point
    double dataMin{-1}; // Minimum amplitude of data
    double dataMax{2}; // Maximum amplitude of data

    /* Setting up Painter */
    QPainter p(this);
    p.setPen(Qt::blue);
    p.setRenderHint(QPainter::Antialiasing);
    QPolygonF polyline; // To draw lines to connect two points with different x-coordinates
    QPainterPath path; // To draw abstract lines with same x-coordinate but different y-coordinates

    /* NOTE: QPainter path is used because it has a moveTo functionality i.e. path's coordinates can be changed without creating a line from previous coordinate to new one. Same is not true for QPolygonF and so it is used to draw the continuous line */

    /************************************************
     ***** Mapping Data to rect() of mainWindow *****
     ************************************************/
    QVector<int> py; // Point Y
    QVector<int> sy; // Serial Y
    QVector<int> sySize; // Sizes of sy
    QVector<double> val; // Y Value for different groups of data
    int x_cur{0}; // x-value for current data set
    int x_prv{0}; // x-value for previous data set
    int y{0};
    int majy{0}; // Major Y i.e. the value which QPolygonF will follow
    double miny{0}; // Minimum Y: Start Point of QPainterPath
    double maxy{0}; // Minimum Y: End Point of QPainterPath
    int idy{0}; // ID to identity Value of Major Y

    /* This only works for data size larger than width of screen. For data size smaller than screen a much simpler approach is used but is not shown here */
    if(data.size() > width())
    {
        path.clear();
        for(int ii = 0; ii < (width() + 1); ++ii)
        {
            py.clear();
            x_cur = round(ii * (numOfPoints/width()));
            if(ii != 0)
            {
                for(int jj = x_prv; jj < x_cur; ++jj)
                {
                    y = round(height() * (dataMin + (dataMax - dataMin) - data[jj]) / (dataMax - dataMin));
                    if(!py.contains(y)) { py << y; }
                }
                if(py.size() == 1) { polyline << QPointF((ii - 1.0), py[0]); }
                else
                {
                    std::sort(py.begin(), py.end());
                    sy.clear();
                    sySize.clear();
                    val.clear();
                    majy = 0;
                    miny = 0.0;
                    maxy = 0.0;
                    idy = 0;
                    for(int jj = 0; jj < py.size(); ++jj)
                    {
                        if(jj == 0) { sy << py[jj]; }
                        else
                        {
                            if(py[jj] == (py[jj - 1] + 1)) { sy << py[jj]; }
                            else
                            {
                                double newVal{0.0};
                                for(int kk = 0; kk < sy.size(); ++kk)
                                {
                                    newVal = newVal + sy[kk];
                                }
                                val.append(newVal / sy.size());
                                sySize << sy.size();
                                sy.clear();
                                sy << py[jj];
                            }
                        }
                    }
                    double newVal{0.0};
                    for(int kk = 0; kk < sy.size(); ++kk)
                    {
                        newVal = newVal + sy[kk];
                    }
                    val.append(newVal / sy.size());
                    sySize << sy.size();
                    if (val.size() == 1) { polyline << QPointF((ii - 1.0), val[0]); }
                    else
                    {
                        for(int kk = 0; kk < sySize.size(); ++kk)
                        {
                            if(sySize[kk] > majy)
                            {
                                majy = sySize[kk];
                                idy = kk;
                            }
                        }
                        auto result = std::minmax_element(val.begin(), val.end());
                        miny = *result.first;
                        maxy = *result.second;
                        polyline << QPointF((ii - 1.0), val[idy]);
                        path.moveTo(QPointF((ii - 1.0), miny));
                        path.lineTo(QPointF((ii - 1.0), maxy));
                    }
                }
            }
            x_prv = x_cur;
        }
    }
    p.drawPolyline(polyline);
    p.drawPath(path);
}
At the end this is what I get:

- Using
-
Hi
I could not reproduce it as such.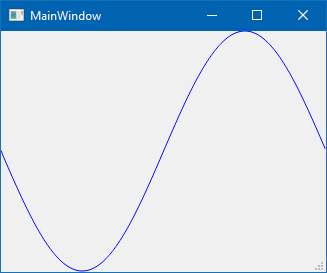
Maybe your pixels are a bit off but you said you used doubles and i assume you then
also used the QPointF version ?void MainWindow::paintEvent(QPaintEvent *event) { QPainter p(this); p.setPen( Qt::blue ); p.setRenderHint( QPainter::Antialiasing ); QPolygonF polyline; int h_div_2 = height() / 2; for( int x = 0; x < width(); x++) { float y = h_div_2 + sin( x * 6.28f / width() ) * h_div_2; polyline << QPointF( x, y ); } p.drawPolyline( polyline ); } -
Hi
I could not reproduce it as such.Maybe your pixels are a bit off but you said you used doubles and i assume you then
also used the QPointF version ?void MainWindow::paintEvent(QPaintEvent *event) { QPainter p(this); p.setPen( Qt::blue ); p.setRenderHint( QPainter::Antialiasing ); QPolygonF polyline; int h_div_2 = height() / 2; for( int x = 0; x < width(); x++) { float y = h_div_2 + sin( x * 6.28f / width() ) * h_div_2; polyline << QPointF( x, y ); } p.drawPolyline( polyline ); }@mrjj Thanks for the reply. You are constructing the data based on the size of your
MainWindowi.e. you are using thewidth()of theMainWindowin your calculation of sine wave, this will always produce a smooth curve because it will calculate the exact y-coordinate for each x-coordinate of yourMainWindow. I have to plot the recorded data with high sampling frequency i.e. the data that I am trying to plot is independent of thewidth()andheight()of mymainWindowand so I have to map it to mymainWindow:void mainWindow::paintEvent(QPaintEvent *event) { /* Constructing Demo Line Plot */ int numOfPoints{100000}; // Data Length is 100 Thousand QVector<double> data; // Data Vector of 100 Thousand for(int ii = 0; ii < numOfPoints; ++ii) { data << (1 * sin (2 * M_PI * 5 * ii/numOfPoints)); // Sine Wave: Amplitude = 1; Frequency = 5 } data[50000] = 2; // Adding a single point of amplitude 2 at 50 thousandth data point double dataMin{-1.0}; // Minimum amplitude of data double dataMax{2.0}; // Maximum amplitude of data /* Setting up Painter */ QPainter p(this); p.setPen(Qt::blue); p.setRenderHint(QPainter::Antialiasing); QPolygonF polyline; /* Mapping data to rect() of mainWindow */ for(int ii = 0; ii < numOfPoints; ++ii) { double px = width() * ii / numOfPoints; double py = height() * (dataMin + (dataMax - dataMin) - data[ii]) / (dataMax - dataMin); polyline << QPointF(px, py); } p.drawPolyline(polyline); }This produces the following result:
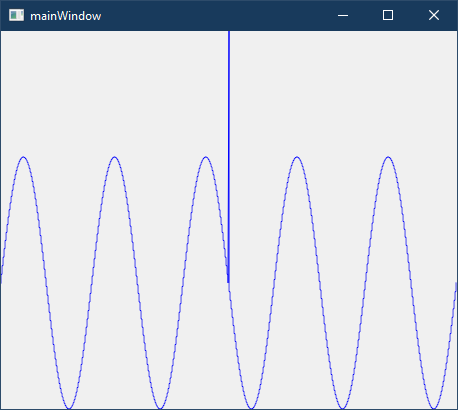
The lines are not smooth, and I don't know how to fix it.
-
Hi! I am trying to make a line plot in
QWidget. To obtain the line plot I map the X and Y points of my data point to its correct position inQWidgetand then draw a line usingQPainter'sdrawLine()function connecting previous point to the current point. The data points are huge (in tens or hundreds of thousands). What I get is the following:Aliased:
Anti-alised:
In both of the above examples, the pen width is 1 and 100,000 data points are plotted in a sine wave with frequency 10 and amplitude 1. There is one data point at the center which is of value 2 which stands out, this is because I need to accommodate spikes in my plot. Since I need to accommodate spikes, I cannot use any kind of algorithm based smoothing (such as using Bezier Curves). This leaves me with options such as anti-alising and painting tricks, but as you can see above anti-alising doesn't produce a good result. I have tried the following as well:- Using
doubleprecision instead ofintegerprecision for mapping the X and Y data points to it's correct position onQWidget. This significantly increases the calculation time but the final plot looks the same as if I would have done the calculation with integer precision. - Painting my line plot on a
QImage4 times the size of the plot area, then applying anti-alising to it and then shrink it to correct size. This also increases calculation time significantly but the final plot again looks the same as above.
I don't think using OpenGL Paint Engine is a good idea as explained in this QOpenGLPaintDevice Class document. Is there any way I can improve the rendering of my line plots?
@CJha Found a solution. This works quite fast, 100k data points plotted in around 15 - 20 ms.
void mainWindow::paintEvent(QPaintEvent *event)
{
    /* Constructing Line Plot */
    double numOfPoints{100000}; // Data Length is 100 Thousand
    QVector<double> data; // Data Vector of 100 Thousand
    for(int ii = 0; ii < numOfPoints; ++ii)
    {
        // Sine Wave: Amplitude = 1; Frequency = 10
        data << (1 * sin (2 * M_PI * 5 * ii/numOfPoints));
    }
    int midPoint = round(numOfPoints/2);
    data[midPoint] = 2; // Adding a single point of amplitude 2 at 50 thousandth data point
    double dataMin{-1}; // Minimum amplitude of data
    double dataMax{2}; // Maximum amplitude of data

    /* Setting up Painter */
    QPainter p(this);
    p.setPen(Qt::blue);
    p.setRenderHint(QPainter::Antialiasing);
    QPolygonF polyline; // To draw lines to connect two points with different x-coordinates
    QPainterPath path; // To draw abstract lines with same x-coordinate but different y-coordinates

    /* NOTE: QPainter path is used because it has a moveTo functionality i.e. path's coordinates can be changed without creating a line from previous coordinate to new one. Same is not true for QPolygonF and so it is used to draw the continuous line */

    /************************************************
     ***** Mapping Data to rect() of mainWindow *****
     ************************************************/
    QVector<int> py; // Point Y
    QVector<int> sy; // Serial Y
    QVector<int> sySize; // Sizes of sy
    QVector<double> val; // Y Value for different groups of data
    int x_cur{0}; // x-value for current data set
    int x_prv{0}; // x-value for previous data set
    int y{0};
    int majy{0}; // Major Y i.e. the value which QPolygonF will follow
    double miny{0}; // Minimum Y: Start Point of QPainterPath
    double maxy{0}; // Minimum Y: End Point of QPainterPath
    int idy{0}; // ID to identity Value of Major Y

    /* This only works for data size larger than width of screen. For data size smaller than screen a much simpler approach is used but is not shown here */
    if(data.size() > width())
    {
        path.clear();
        for(int ii = 0; ii < (width() + 1); ++ii)
        {
            py.clear();
            x_cur = round(ii * (numOfPoints/width()));
            if(ii != 0)
            {
                for(int jj = x_prv; jj < x_cur; ++jj)
                {
                    y = round(height() * (dataMin + (dataMax - dataMin) - data[jj]) / (dataMax - dataMin));
                    if(!py.contains(y)) { py << y; }
                }
                if(py.size() == 1) { polyline << QPointF((ii - 1.0), py[0]); }
                else
                {
                    std::sort(py.begin(), py.end());
                    sy.clear();
                    sySize.clear();
                    val.clear();
                    majy = 0;
                    miny = 0.0;
                    maxy = 0.0;
                    idy = 0;
                    for(int jj = 0; jj < py.size(); ++jj)
                    {
                        if(jj == 0) { sy << py[jj]; }
                        else
                        {
                            if(py[jj] == (py[jj - 1] + 1)) { sy << py[jj]; }
                            else
                            {
                                double newVal{0.0};
                                for(int kk = 0; kk < sy.size(); ++kk)
                                {
                                    newVal = newVal + sy[kk];
                                }
                                val.append(newVal / sy.size());
                                sySize << sy.size();
                                sy.clear();
                                sy << py[jj];
                            }
                        }
                    }
                    double newVal{0.0};
                    for(int kk = 0; kk < sy.size(); ++kk)
                    {
                        newVal = newVal + sy[kk];
                    }
                    val.append(newVal / sy.size());
                    sySize << sy.size();
                    if (val.size() == 1) { polyline << QPointF((ii - 1.0), val[0]); }
                    else
                    {
                        for(int kk = 0; kk < sySize.size(); ++kk)
                        {
                            if(sySize[kk] > majy)
                            {
                                majy = sySize[kk];
                                idy = kk;
                            }
                        }
                        auto result = std::minmax_element(val.begin(), val.end());
                        miny = *result.first;
                        maxy = *result.second;
                        polyline << QPointF((ii - 1.0), val[idy]);
                        path.moveTo(QPointF((ii - 1.0), miny));
                        path.lineTo(QPointF((ii - 1.0), maxy));
                    }
                }
            }
            x_prv = x_cur;
        }
    }
    p.drawPolyline(polyline);
    p.drawPath(path);
}
At the end this is what I get:
- Using