
I had an incredible hard time to align horizontally 3 charts (Qt 5.13.2)
-
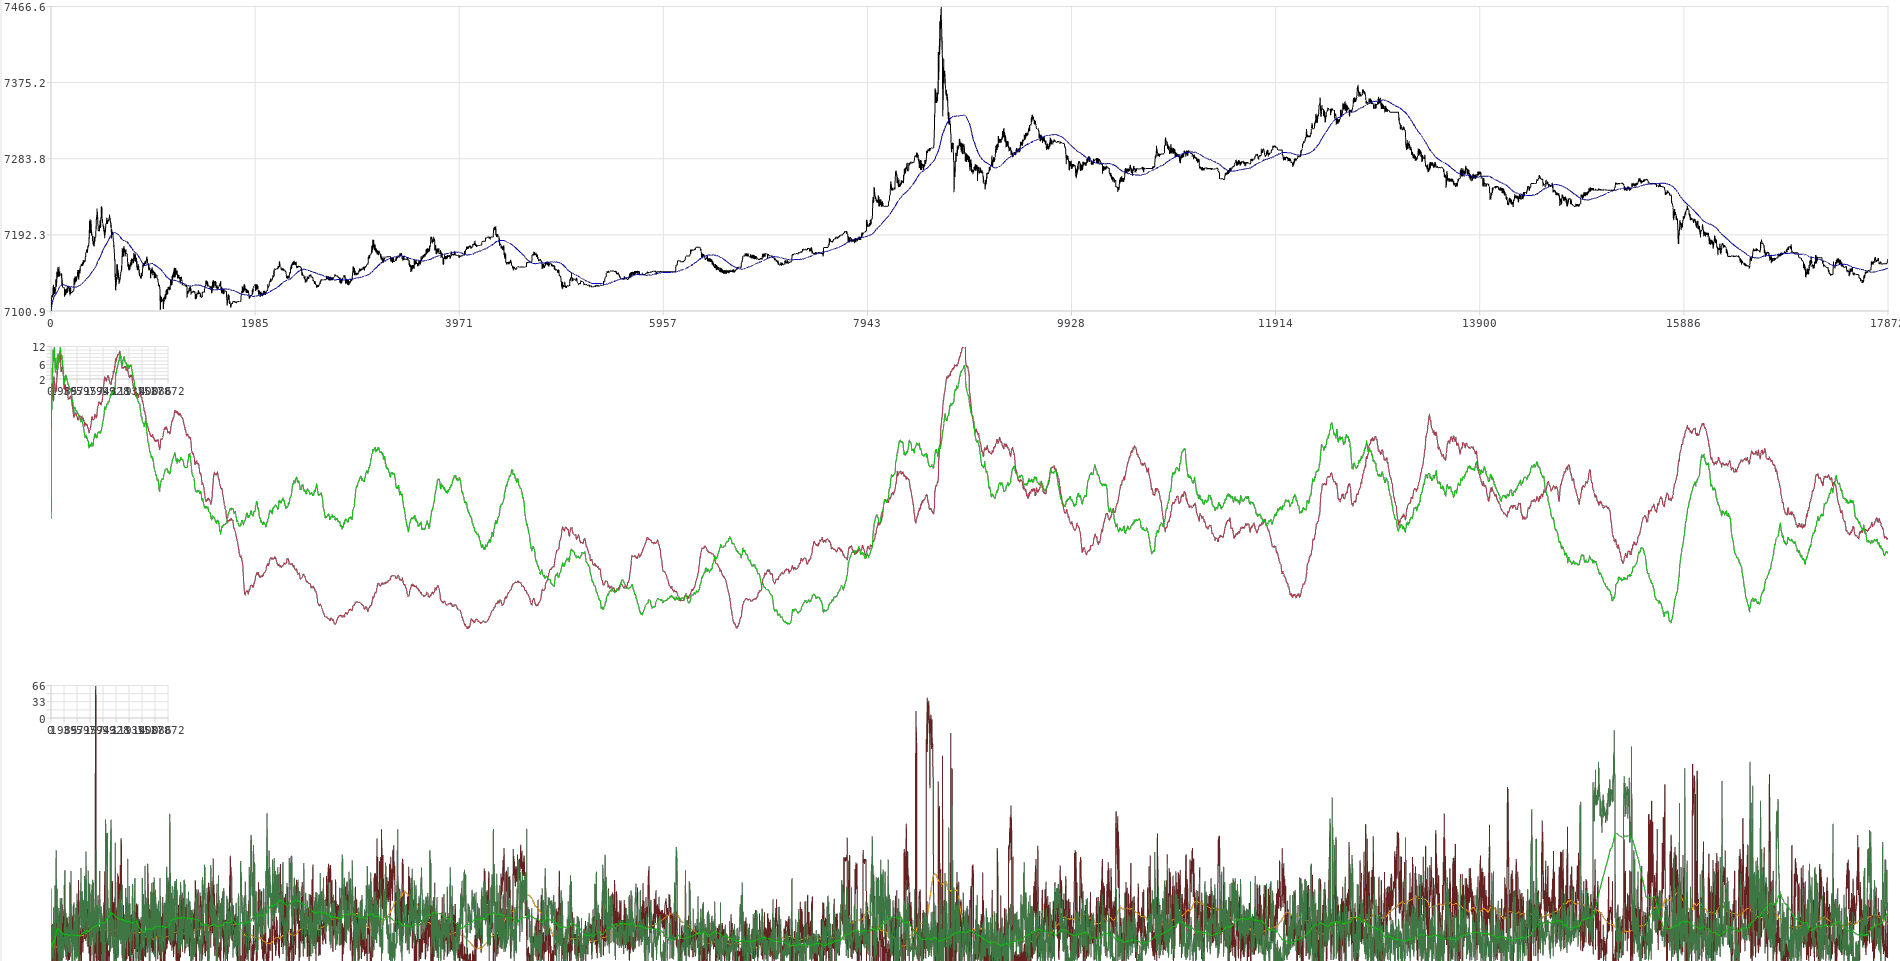
The initial issue that I had was that 3 charts placed into a QVBoxLayout, having identical X axis were not aligned because the topmost chart Y axis labels were longer than the 2 other charts:

As you can see, I have finally succeeded but in the long and hard journey to find a working way, I think that I have stumbled into a serie of small QtCharts glitches. Therefore, I am documenting here what I have observed to help you guys improving the code in a future release.
- My first attempt has been with the axis label format:
m_YAxis->setLabelFormat("%6d");That didn't work. It seems like the width modifier is disregarded.
- The next intuitive attempt was to connect the topmost chart signal 'plotAreaChanged' with a slot in the 2 other charts such as:
void LinkedChart::peerPlotAreaChanged(const QRectF &pa)
{
    if (!plotArea().isNull()) {
        setPlotArea(pa);
    }
}
While it sounds like a good idea, the result is horrific... It seems like some QChart code area aren't informed of the new plot area dimension...
- I did finally manage to do what I wanted with this slot in the 2 mid and bottom charts:
void LinkedChart::peerPlotAreaChanged(const QRectF &pa)
{
    if (!plotArea().isNull()) {
        QMargins curMargins = margins();
        curMargins.setLeft(curMargins.left()+pa.left()-plotArea().left());
        setMargins(curMargins);
    }
}
This does what I want but at startup, the 2 charts have the time to be painted with their old margins value and you can see them adjusted some time after the startup. Probably just me who would notice but this annoys the perfectionist that I am...I might try to find a way to set correctly the margins at construction....
-
The initial issue that I had was that 3 charts placed into a QVBoxLayout, having identical X axis were not aligned because the topmost chart Y axis labels were longer than the 2 other charts:
As you can see, I have finally succeeded but in the long and hard journey to find a working way, I think that I have stumbled into a serie of small QtCharts glitches. Therefore, I am documenting here what I have observed to help you guys improving the code in a future release.
- My first attempt has been with the axis label format:
m_YAxis->setLabelFormat("%6d");That didn't work. It seems like the width modifier is disregarded.
- The next intuitive attempt was to connect the topmost chart signal 'plotAreaChanged' with a slot in the 2 other charts such as:
void LinkedChart::peerPlotAreaChanged(const QRectF &pa)
{
    if (!plotArea().isNull()) {
        setPlotArea(pa);
    }
}
While it sounds like a good idea, the result is horrific... It seems like some QChart code area aren't informed of the new plot area dimension...
- I did finally manage to do what I wanted with this slot in the 2 mid and bottom charts:
void LinkedChart::peerPlotAreaChanged(const QRectF &pa)
{
    if (!plotArea().isNull()) {
        QMargins curMargins = margins();
        curMargins.setLeft(curMargins.left()+pa.left()-plotArea().left());
        setMargins(curMargins);
    }
}
This does what I want but at startup, the 2 charts have the time to be painted with their old margins value and you can see them adjusted some time after the startup. Probably just me who would notice but this annoys the perfectionist that I am...I might try to find a way to set correctly the margins at construction....
Hi @lano1106, thank you for sharing such a detailed investigation; I'm glad you found a procedure that achieves what you want (minus the visual glitch at startup). Would you be willing to post this to https://bugreports.qt.io/ ? There's a much higher chance that it gets picked up there and integrated into Qt. Posts on this forum will eventually get buried in time.
-
sure will do.
BTW, I think that having the grid/axis not resized in #2 of the OP could be related to my latest discovery in:
https://forum.qt.io/topic/110370/issue-with-qchart-layout-when-resizing-the-parent-qchartview-qt-5-14-0 -