
Plot EEG samples
-
Hi.
I want to plot lots of eeg samples from eeg device. something like below image.
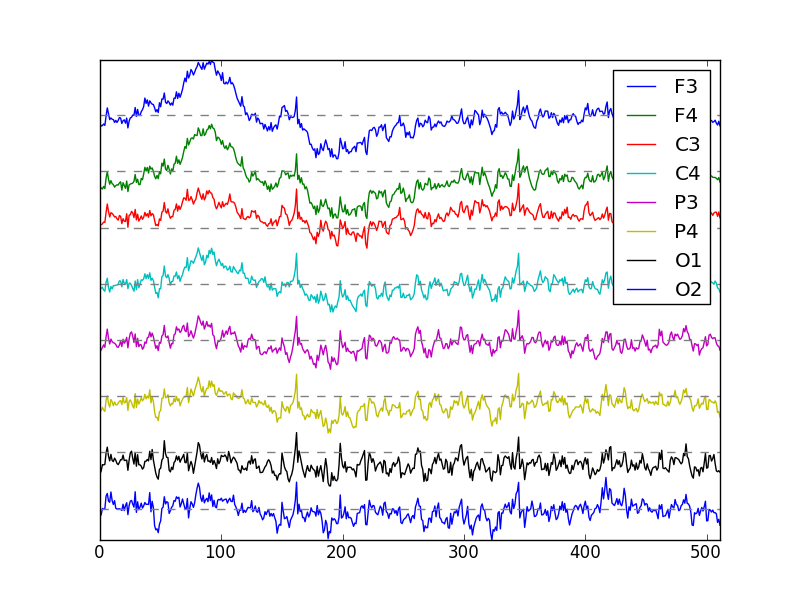
As you can see, there is no specific boundary for each plot, so I can not divide space between plots. Plots can overlap with each other.
Right now I'm trying to implement this with overlapping widgets with transparent background, hidden axes, just showing lines and nothing else (QCustomPlot or QChartView). Both approaches are slow, when sample rate is more than e.g. 100 samples per second. QChartView is even worse when number of point increase.I need advise on how to implement such thing :-(
Is downsampling of data works? please help.
Is there a ready-made widget for this work? I could not find a suitable one :-(Requirements:
- User can scale both X and Y axes with a scale combobox
- Widget can show live and continous incoming data as well as showing whole data at once
-
Hi
How come QCustomplots customPlot->addGraph
cannot be used to have multiple graphs ?
That is simply too slow ? -
@mrjj said in Plot EEG samples:
Hi
How come QCustomplots customPlot->addGraph
cannot be used to have multiple graphs ?
That is simply too slow ?I Know this method, but there is a problem with this approach. Values of graphs are independent of eachother. I mean these graphs are not stacked above eachother with a fixed distance value of y. They are independent graphs. With this approach in your link, scaling on Y axis increases or decreases distance between each graph, but each of them has its own independent axis and zero line (gray dashed line in my image above)
-
@mrjj said in Plot EEG samples:
Hi
How come QCustomplots customPlot->addGraph
cannot be used to have multiple graphs ?
That is simply too slow ?I Know this method, but there is a problem with this approach. Values of graphs are independent of eachother. I mean these graphs are not stacked above eachother with a fixed distance value of y. They are independent graphs. With this approach in your link, scaling on Y axis increases or decreases distance between each graph, but each of them has its own independent axis and zero line (gray dashed line in my image above)
@MajidKamali
Ok in that way.
I dont recall seeing a widget that has this sort of multi graph.