
Qt Graphs lacking functionalities - Axes range
-
I'm using Qt Graphs for real-time data plotting, but I've been running into a lot of issues due to its lack of functionality. I've managed to work around most of them, but this one seems impossible to solve.
I need to get the x-axis range after zooming or panning, but
axisX.minalways returns the same seemingly meaningless value (25.626488705368423). The Plot is a registered singleton exposed to QML.Here’s the relevant code:
axisX: ValueAxis {
    min: Plot.xMin
    max: Plot.xMax
    onZoomChanged: {
        Plot.handleRangeChanged(axisX.min, axisX.max)
    }
}
No matter what I try, I can’t get the actual updated range or zoom values.
On top of this, there are many other small inconveniences with Qt Graphs that make the module feel almost unusable. Qt Charts, on the other hand, seems to offer these features, but I haven’t used it because the official documentation recommends switching to Graphs.
So my questions are:
- How do I get the actual range or zoom values?
- Why is the switch recommended if Qt Graphs is nowhere near as powerful as Qt Charts?
- When (if ever) can we expect these missing functionalities to be available in Qt Graphs?
-
Based on what I have seen, I couldn't recommend using Graphs yet. We had Qt reps at our company plugging Graphs and giving us presentations about it but it turns out that there a number of essential aspects of our current Charts usage that simply aren't supported by Graphs yet. It seems to be a work in progress at the moment. Charts may no longer be being actively developed but it is going to be around for a while yet.
I want to add charts to a Qt app.
We are still using Qt5 because Qt6 doesn't support all the text encodings that Qt5 does (on Mac anyway). Also it sounds like QtGraphs isn't production ready yet. So QtGraphs isn't an option at present. So we are considering implementing the charts in QtCharts, and then transitioning to Qt 6 and QtGraphs later, if required.
Is there any word on how long Qt Charts is going to be supported?
Our app is fully C++ and QWidgets. I understand QtGraphs is currently QML only. Are there going to be a QWidget classes for graphs in QtGraphs? How similar are these classes going to be to the QtChart equivalents?
-
I want to add charts to a Qt app.
We are still using Qt5 because Qt6 doesn't support all the text encodings that Qt5 does (on Mac anyway). Also it sounds like QtGraphs isn't production ready yet. So QtGraphs isn't an option at present. So we are considering implementing the charts in QtCharts, and then transitioning to Qt 6 and QtGraphs later, if required.
Is there any word on how long Qt Charts is going to be supported?
Our app is fully C++ and QWidgets. I understand QtGraphs is currently QML only. Are there going to be a QWidget classes for graphs in QtGraphs? How similar are these classes going to be to the QtChart equivalents?
@AndyBrice said in Qt Graphs lacking functionalities - Axes range:
I want to add charts to a Qt app.
Our app is fully C++ and QWidgets. I understand QtGraphs is currently QML only. Are there going to be a QWidget classes for graphs in QtGraphs? How similar are these classes going to be to the QtChart equivalents?
https://doc.qt.io/qt-6/graphs.html
Qt Graphs C++ Classes
The Qt Graphs functionality can be accessed via these C++ classes.
Qt Graphs C++ Classes for 2D C++ classes for the Qt Graphs for 2D API Qt Graphs C++ Classes for 3D C++ classes for the Qt Graphs for 3D API Qt Graphs C++ Classes for Widgets C++ classes for the Qt Graphs for 3D API used with widgets Qt Graphs C++ Common Classes C++ classes for the Qt Graphs common API -
I took a look and I am still quite confused. Are there any example for adding a 2D chart into a C++/QWidget based application?
@AndyBrice said in Qt Graphs lacking functionalities - Axes range:
I took a look and I am still quite confused. Are there any example for adding a 2D chart into a C++/QWidget based application?
Look at https://code.qt.io/cgit/qt/qtcharts.git/tree/examples/charts to browse through the examples. Not all of them start with
qml. -
@AndyBrice said in Qt Graphs lacking functionalities - Axes range:
I took a look and I am still quite confused. Are there any example for adding a 2D chart into a C++/QWidget based application?
Look at https://code.qt.io/cgit/qt/qtcharts.git/tree/examples/charts to browse through the examples. Not all of them start with
qml.@cristian-adam this is for the old module Qt Charts, not Qt Graphs.
-
I just had a closer look at the docs. It seems that 2D Graphs (which I guess is the closest equivalent to the old Qt Charts) are only supported in Qt Quick applications, which is a little surprising to me given my awareness of how much Qt Charts are used in various Qt Widgets applications where I work. The documentation suggests using a QQuickWidget in order to embed this functionality in a Qt Widgets application:
https://doc.qt.io/qt-6/qtgraphs-2d-quickwidgetgraphs-example.html
-
@cristian-adam this is for the old module Qt Charts, not Qt Graphs.
@GrecKo said in Qt Graphs lacking functionalities - Axes range:
@cristian-adam this is for the old module Qt Charts, not Qt Graphs.
Sorry. My bad. The Qt Graphs examples at https://code.qt.io/cgit/qt/qtgraphs.git/tree/examples they all have the
qmlpart. -
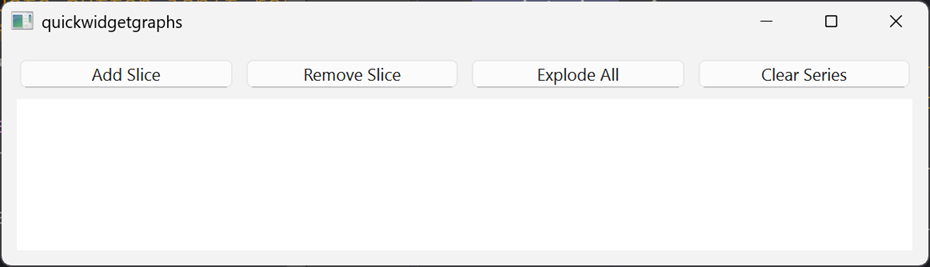
I had a play with the examples installed in Qt\Examples\Qt-6.10.0\graphs\2d with Qt 6.10 and was a bit underwhelmed.
quickwidgetgraphs doesn't work, nothing happens when you click on the buttons:
hellographs is QML in a QQuickView .
cockpit isn't relevant for me.
Is QtGraphs going to have a C++/widget API similar to QCharts (even if it is just a wrapper over the QML)? Or are people expected to throw away all the QtCharts/widget code and rewrite it all from scratch in QtGraphs/QML?