
How to create custom text within bar graphs?
-
I have a QHorizontalPercentBarSeries graph, and I am currently putting in generic data to test to see if it is possible to insert a custom text to show number values, instead of just percentage within the bars.
The code I currently have is as followed,
    // Creating the bars for the data to reside within
    QtCharts::QBarSet *remainingToolLifeSet = new QtCharts::QBarSet("Max Tool Life");
    QtCharts::QBarSet *toolLifeUsedSet = new QtCharts::QBarSet("Tool Life Used");
    remainingToolLifeSet->setColor(QColor(77, 219, 115));
    toolLifeUsedSet->setColor(QColor(213, 38, 56));

    // Adding the data within the bars (this is where we would populate the tool life)
    *remainingToolLifeSet << 95 << 90 << 85 << 80 << 75 << 55 << 50 << 35 << 30 << 25 << 10 << 0;
    *toolLifeUsedSet << 5 << 10 << 15 << 20 << 25 << 45 << 50 << 65 << 70 << 75 << 90 << 100;

    // Adding the bars to the graph
    QtCharts::QHorizontalPercentBarSeries *series = new QtCharts::QHorizontalPercentBarSeries();
    series->append(toolLifeUsedSet);
    series->append(remainingToolLifeSet);

    // Creating the chart itself and initiating the title
    QtCharts::QChart *chart = new QtCharts::QChart();
    chart->addSeries(series);
    chart->setTitle("Tool Life Left");
    chart->setBackgroundBrush(QColor(31, 31, 31));
    chart->setTitleBrush(Qt::white);

    // Adding in the months (whatever it the y axis indicator, in the real example it will be the tool number)
    QStringList categories;
    categories << "2001" << "2002" << "2003" << "2004" << "2005" << "2006" << "2007" << "2008" << "2009" << "2010" << "2011" << "2012";
    QtCharts::QBarCategoryAxis *yAxis = new QtCharts::QBarCategoryAxis();
    yAxis->append(categories);
    chart->addAxis(yAxis, Qt::AlignLeft);
    series->attachAxis(yAxis);
    yAxis->setLabelsColor(Qt::white);

    // Adding in the values (attaching the X Axis and then the graph outputs 0, 25, 50, 100 for percentages)
    QtCharts::QValueAxis *xAxis = new QtCharts::QValueAxis();
    chart->addAxis(xAxis, Qt::AlignBottom);
    series->attachAxis(xAxis);
    xAxis->setLabelsColor(Qt::white);

    // Showing the labels within the bars
    series->setLabelsVisible(true);

    // Making the legend for the graph
    chart->legend()->setVisible(true);
    chart->legend()->setAlignment(Qt::AlignBottom);
    chart->legend()->setLabelColor(Qt::white);

    // Creating a graph view in order to save as an image
    QtCharts::QChartView *chartView = new QtCharts::QChartView(chart);
    chartView ->setRenderHint(QPainter::Antialiasing);

    // Saving the graph itself
    QPixmap pixmap = chartView->grab();
    pixmap.save("C:/Users/Admin/test.png");
Which will output the following picture
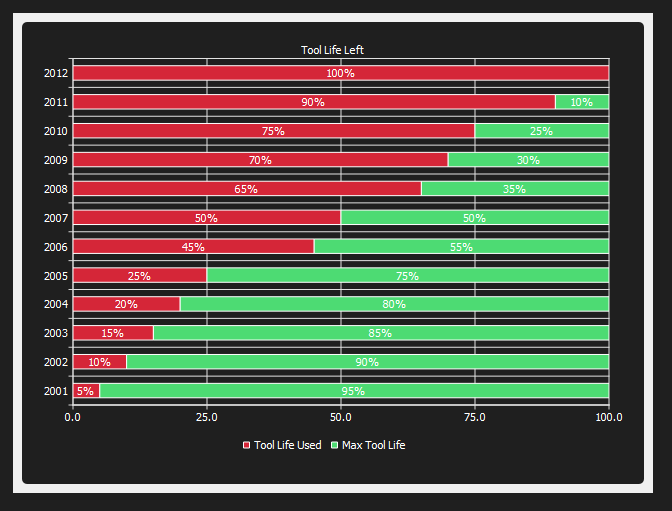
What I would like, is where "90%" and "10%" is in 2011, I would like to have "90% (90 min used)" and "10% (10 min left)".
I do not see any methods to edit this label value within the series, is there any way to do this?
One thought I also had, would be instead of putting it within the bar, being in the 2001 example, this text would not be fully shown as the area is so small, to put it on the far right side? Could just output the tool life left (which would be Max Tool Life - Tool Life Used)...not sure if that is possible either but I will take a look into it. Almost would rather this choice over the above, although not sure if it is possible, again.
Thanks in advance!
edit: also, the "Max Tool Life" used QBarSet should have the parameter "Remaining Tool Life" and not "Max Tool Life", just fixed this issue in my personal code but it is irrelevant to the issue at hand
-
I have a QHorizontalPercentBarSeries graph, and I am currently putting in generic data to test to see if it is possible to insert a custom text to show number values, instead of just percentage within the bars.
The code I currently have is as followed,
    // Creating the bars for the data to reside within
    QtCharts::QBarSet *remainingToolLifeSet = new QtCharts::QBarSet("Max Tool Life");
    QtCharts::QBarSet *toolLifeUsedSet = new QtCharts::QBarSet("Tool Life Used");
    remainingToolLifeSet->setColor(QColor(77, 219, 115));
    toolLifeUsedSet->setColor(QColor(213, 38, 56));

    // Adding the data within the bars (this is where we would populate the tool life)
    *remainingToolLifeSet << 95 << 90 << 85 << 80 << 75 << 55 << 50 << 35 << 30 << 25 << 10 << 0;
    *toolLifeUsedSet << 5 << 10 << 15 << 20 << 25 << 45 << 50 << 65 << 70 << 75 << 90 << 100;

    // Adding the bars to the graph
    QtCharts::QHorizontalPercentBarSeries *series = new QtCharts::QHorizontalPercentBarSeries();
    series->append(toolLifeUsedSet);
    series->append(remainingToolLifeSet);

    // Creating the chart itself and initiating the title
    QtCharts::QChart *chart = new QtCharts::QChart();
    chart->addSeries(series);
    chart->setTitle("Tool Life Left");
    chart->setBackgroundBrush(QColor(31, 31, 31));
    chart->setTitleBrush(Qt::white);

    // Adding in the months (whatever it the y axis indicator, in the real example it will be the tool number)
    QStringList categories;
    categories << "2001" << "2002" << "2003" << "2004" << "2005" << "2006" << "2007" << "2008" << "2009" << "2010" << "2011" << "2012";
    QtCharts::QBarCategoryAxis *yAxis = new QtCharts::QBarCategoryAxis();
    yAxis->append(categories);
    chart->addAxis(yAxis, Qt::AlignLeft);
    series->attachAxis(yAxis);
    yAxis->setLabelsColor(Qt::white);

    // Adding in the values (attaching the X Axis and then the graph outputs 0, 25, 50, 100 for percentages)
    QtCharts::QValueAxis *xAxis = new QtCharts::QValueAxis();
    chart->addAxis(xAxis, Qt::AlignBottom);
    series->attachAxis(xAxis);
    xAxis->setLabelsColor(Qt::white);

    // Showing the labels within the bars
    series->setLabelsVisible(true);

    // Making the legend for the graph
    chart->legend()->setVisible(true);
    chart->legend()->setAlignment(Qt::AlignBottom);
    chart->legend()->setLabelColor(Qt::white);

    // Creating a graph view in order to save as an image
    QtCharts::QChartView *chartView = new QtCharts::QChartView(chart);
    chartView ->setRenderHint(QPainter::Antialiasing);

    // Saving the graph itself
    QPixmap pixmap = chartView->grab();
    pixmap.save("C:/Users/Admin/test.png");
Which will output the following picture
What I would like, is where "90%" and "10%" is in 2011, I would like to have "90% (90 min used)" and "10% (10 min left)".
I do not see any methods to edit this label value within the series, is there any way to do this?
One thought I also had, would be instead of putting it within the bar, being in the 2001 example, this text would not be fully shown as the area is so small, to put it on the far right side? Could just output the tool life left (which would be Max Tool Life - Tool Life Used)...not sure if that is possible either but I will take a look into it. Almost would rather this choice over the above, although not sure if it is possible, again.
Thanks in advance!
edit: also, the "Max Tool Life" used QBarSet should have the parameter "Remaining Tool Life" and not "Max Tool Life", just fixed this issue in my personal code but it is irrelevant to the issue at hand
-
O orsini29 has marked this topic as solved on