Skip to content
  • Categories
  • Recent
  • Tags
  • Popular
  • Users
  • Groups
  • Search
  • Get Qt Extensions
  • Unsolved
Collapse
Brand Logo
  1. Home
  2. Qt Development
  3. General and Desktop
  4. Set tick position and tick name of axis X on Qt chart.
Forum Updated to NodeBB v4.3 + New Features

Set tick position and tick name of axis X on Qt chart.

Scheduled Pinned Locked Moved Unsolved General and Desktop
6 Posts 2 Posters 2.5k Views 2 Watching
  • Oldest to Newest
  • Newest to Oldest
  • Most Votes
Reply
  • Reply as topic
Log in to reply
This topic has been deleted. Only users with topic management privileges can see it.
  • J Offline
    J Offline
    javad_2012
    wrote on last edited by
    #1

    Hello everyone.
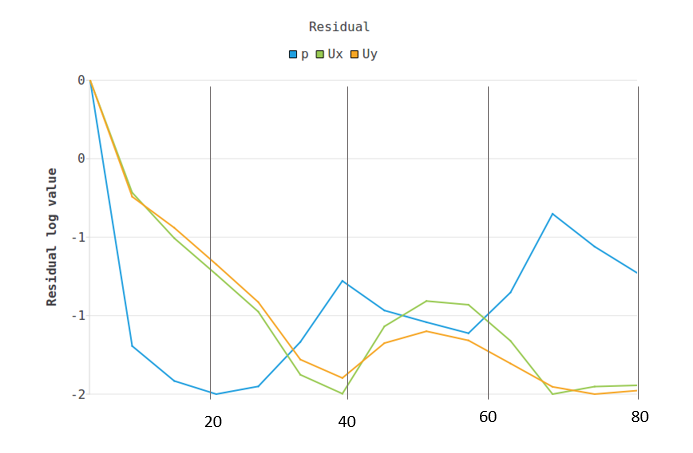
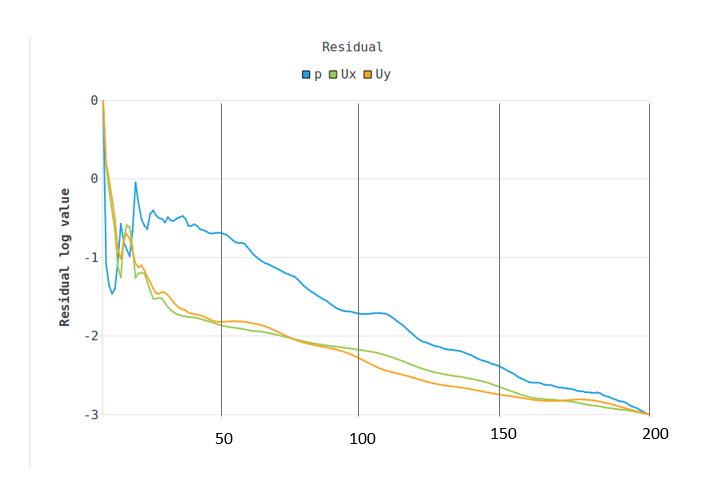
    I have a dynamic qchart that updates every 50 milliseconds. I want to change the name and position of ticks on the chart dynamically. For example, when I have less data, the difference between two ticks will be 20 (picture 1) and when I have more data, the difference between two ticks will be 50 (picture 2) and then 150, and so on.
    I research it and found out, that I should use the "QCategoryAxis" but unfortunately, I did not find a simple and useful example.
    Is there any link or does anyone know about it?

    Thanks in advance.
    1.PNG

    2.PNG

    1 Reply Last reply
    0
    • A.A.SEZENA Offline
      A.A.SEZENA Offline
      A.A.SEZEN
      wrote on last edited by
      #2

      I assume the system configuration is sufficient for 50ms time. There may be two options. The first is to create a new chart each time (not a chartview) and delete the old one. The other is to update the axis max and min values ​​with the series on the same chart. It seems from your example that in this case the series values ​​will mostly be reloaded. I think the cost and code cleanup of the first option would be more appropriate.

      J 1 Reply Last reply
      0
      • A.A.SEZENA A.A.SEZEN

        I assume the system configuration is sufficient for 50ms time. There may be two options. The first is to create a new chart each time (not a chartview) and delete the old one. The other is to update the axis max and min values ​​with the series on the same chart. It seems from your example that in this case the series values ​​will mostly be reloaded. I think the cost and code cleanup of the first option would be more appropriate.

        J Offline
        J Offline
        javad_2012
        wrote on last edited by
        #3

        @A-A-SEZEN Thanks for the reply.
        yes. It is a better option to create a new chart each time and I implemented it and the main problem is the axis. I want to have ticks with my own label differences. like the first tick has label 20, the second one 40, the third one 60, and so on.

        1 Reply Last reply
        0
        • A.A.SEZENA Offline
          A.A.SEZENA Offline
          A.A.SEZEN
          wrote on last edited by
          #4

          Could you be talking about the QValueAxis::setTickCount(int count) property? Because it will automatically partition as many as you want. Or maybe I still don't understand what you're talking about.

          J 1 Reply Last reply
          0
          • A.A.SEZENA A.A.SEZEN

            Could you be talking about the QValueAxis::setTickCount(int count) property? Because it will automatically partition as many as you want. Or maybe I still don't understand what you're talking about.

            J Offline
            J Offline
            javad_2012
            wrote on last edited by
            #5

            @A-A-SEZEN Yes, It partitions as many as I want, but the distance between each partition is my goal. For example, I need ticks with 50 differences between each tick(like picture 2 I sent before). But in QValueAxis::setTickCount(int count), I can just set the number of ticks, not the position of each tick. It may be tacked to me ticks with 35 differences between each tick.

            1 Reply Last reply
            0
            • A.A.SEZENA Offline
              A.A.SEZENA Offline
              A.A.SEZEN
              wrote on last edited by
              #6

              setTickType, setTickAnchor, setTickInterval, setTickCount... Examine and use these assignments. I can say that you will achieve the result by adjusting the values ​​you want in each chart renewal.

              1 Reply Last reply
              0

              • Login

              • Login or register to search.
              • First post
                Last post
              0
              • Categories
              • Recent
              • Tags
              • Popular
              • Users
              • Groups
              • Search
              • Get Qt Extensions
              • Unsolved