
Superimposed an arbitrary number of graphs with qchart
-
Hello!
I need to have different graphs on the same plot. These graphs are taken in different moments, i.e I start recording the signal, stop the acquisition after n seconds, and, then, I restart the recording.
The different graphs (taken in different moments) should appear on the same plot, so a comparison will be possible. There isn't a prefixed number of graphs, they can be 1 or 10...
My idea is to "cut" the line at the end of a graph, change the graph color, and start a new sampling.
Unfortunately:- I'm no able to cut the line, when I put my origin in 0,0 a straight line from the last point to 0,0 appears.
- When I change the pen color, also the old points change their color.
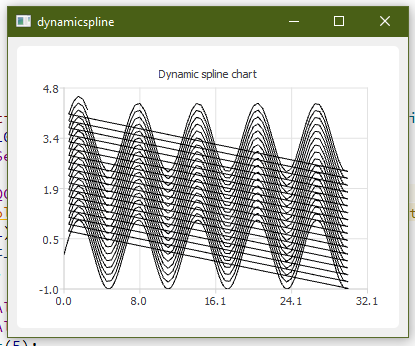
I modified the QT example "Dynamic Spline":
....
void Chart::handleTimeout()
{
    m_series->setUseOpenGL(true);
    m_axisX->setTickCount(5);
    qreal value_x=xi+0.2;
    m_x += value_x;
    m_y=(sin(m_x))+tau;
    if (m_max_Y<m_y)
    {
        m_max_Y=m_y*1.1;
    }
    if (m_min_Y>m_y)
    {
        m_min_Y=m_y*1.1;
    }
    if (m_max_X<m_x)
    {
        m_max_X=m_x*1.1;
    }
    if (m_min_X>m_x)
    {
        m_min_X=m_x*1.1;
    }

    m_axisY->setRange(m_min_Y, m_max_Y);
    total_tick=total_tick+1;
    m_axisX->setRange(m_min_X, m_max_X);


    m_series->append(m_x, m_y);


    if (m_x > 30)
    {

        m_timer.stop();
        m_x=0;
        m_y=0;
        xi=0.3;
        tau=tau+0.2;
        QPen plot_curve(pencolor);
        m_timer.start();
    }
}
This is the result:
Thank you very much!
-
Hi
Your post must have drifted away. happens sometimes.It seems you try to use only one QSplineSeries to have all samples in.
That will not work color-wise as the old will be plotted using the new color
as it is the same serie. Also Im not sure we can cut the line as it expects
to be continuous points ,Could you not just use mutiple QSplineSeries ?;
just make QSplineSeries *m_series; into a vector and for each snapshot create a new
QSplineSeries. -
Hello, mrjj and thanks for your answer.
My problem is I don't know how many curves I'll have to draw (it can be one or more than ten lines) but they are "sequentially" inserted: so the i.e. second curve starts only when the first one is concluded. I'm afraid that using an array of QSplineSeries can be very memory-using intensive...
Is it possible to "flush" a QsplineSerie and maintains its point simply drawn on the screen, creating the new curves above it?
Thanks a lot! -
Hello, mrjj and thanks for your answer.
My problem is I don't know how many curves I'll have to draw (it can be one or more than ten lines) but they are "sequentially" inserted: so the i.e. second curve starts only when the first one is concluded. I'm afraid that using an array of QSplineSeries can be very memory-using intensive...
Is it possible to "flush" a QsplineSerie and maintains its point simply drawn on the screen, creating the new curves above it?
Thanks a lot!Well a list of QSplineSeries would mostly take up the same needed for the points. so if many points, it
might be heavy.- is it possible to "flush" a QsplineSerie and maintains its point simply drawn on the screen, creating the new curves above it?
Nope. Not that i have seen. not with QChart.
Would require we could render to say an image and then use that as background for the live / current plot.
Maybe we could store as an image and then render the current to image also and then overlay them
to create a still snapshot of them all together or similar.However, if using an image is better than QSplineSeries it's hard to say.
the class seems very light
https://code.woboq.org/qt5/qtcharts/src/charts/splinechart/qsplineseries.cpp.html
so 10 of them should not be an issue unless its a really, really small device.btw, do you need the zoom and pan features of QChart ?
As the graphs you show here seems mostly like a SIN() one and it would be easy to draw it
QPainter and there it would be easy to keep older plots as an image. -
The real program takes real-time data from an STM32 MCU, at the moment I'm using QCustomPlot but I have some problems and I'm going to test QChart, starting from a reduced code.
I tried using something like "QVector<QLineSeries> curves", but QT gives me an error when I start to append the values (error: 'QtCharts::QLineSeries::QLineSeries(const QtCharts::QLineSeries&)' is private).
I had to investigate....
Thanks a lot! -
The real program takes real-time data from an STM32 MCU, at the moment I'm using QCustomPlot but I have some problems and I'm going to test QChart, starting from a reduced code.
I tried using something like "QVector<QLineSeries> curves", but QT gives me an error when I start to append the values (error: 'QtCharts::QLineSeries::QLineSeries(const QtCharts::QLineSeries&)' is private).
I had to investigate....
Thanks a lot!Hi
QLineSeries is a QObject and hence cannot be copied.
That error tells you that copy constrcutor is disabled.so it has to be a pointer
QVector<QLineSeries *> -
@mrjj said in Superimposed an arbitrary number of graphs with qchart:
QVector<QLineSeries *>
Ops.. sorry for my type mismatch: I wrote QVector<QLineSeries > * curves.
QVector<QLineSeries > * curves=new QVector<QLineSeries>;
...
curves->first().append(x,y); //just an example
I re-typed my code:
QVector<QLineSeries *>  curves;
...
curves.first()->append(x,y); //just an example
No error from compiler, but QT said :
ASSERT: "!isEmpty()" in file C:/Qt/5.11.3/mingw53_32/include/QtCore/qvector.h, line 237 -
@mrjj said in Superimposed an arbitrary number of graphs with qchart:
QVector<QLineSeries *>
Ops.. sorry for my type mismatch: I wrote QVector<QLineSeries > * curves.
QVector<QLineSeries > * curves=new QVector<QLineSeries>;
...
curves->first().append(x,y); //just an example
I re-typed my code:
QVector<QLineSeries *>  curves;
...
curves.first()->append(x,y); //just an example
No error from compiler, but QT said :
ASSERT: "!isEmpty()" in file C:/Qt/5.11.3/mingw53_32/include/QtCore/qvector.h, line 237@lagodolio
Hi
well the list is empty so first will return null.since we have pointers to QLineSeries , you must new and apprend
QVector<QLineSeries * > curves; // no need to be a pointer to the list curves.append(new QLineSeries ); curves.first()->append(x,y); -
Np. :)
The real app that gets data from the STM32 MCU, what is that running on? -
Np. :)
The real app that gets data from the STM32 MCU, what is that running on?@mrjj
An STM32F7 with a loadcell (and a 24/32bit ADC) + a PTC (16bit ADC )send data and timer values from its RTC @400sps, while the QT program sends ADC setup (sample rate, filters) and generic commands (reset, calibration, etc.)
In addition, by QChart, a real-time graph is shown.
My problem is that QCustomplot runs great with 50-80sps, while it has a great latency with 100sps or more. I tested the output with the Arduino IDE Serial Plotter monitor without problems @1200sps (but that sample rate is excessive!) -
@mrjj
An STM32F7 with a loadcell (and a 24/32bit ADC) + a PTC (16bit ADC )send data and timer values from its RTC @400sps, while the QT program sends ADC setup (sample rate, filters) and generic commands (reset, calibration, etc.)
In addition, by QChart, a real-time graph is shown.
My problem is that QCustomplot runs great with 50-80sps, while it has a great latency with 100sps or more. I tested the output with the Arduino IDE Serial Plotter monitor without problems @1200sps (but that sample rate is excessive!)Hi
Nice hardware :)
So you indeed a bit memory constrained.Arduino IDE Serial Plotter
As far as i recall, its just a basic plotter with no zoom or pan features?
I guess that's how it can be that fast.I hope then QChart works for you.