
How to open stack trace in QT?
-
#include<bits/stdc++.h>
void badFunction(){
    throw std::out_of_range("");
}
int main(){
    badFunction();
    return 0;
}
Just like the code above. When I use debug mode to run the code, it will terminate immediately and leave only a message of terminate called after throwing out_of_range.
Imagine this is a big project with hundreds and thousands of functions in it. When it throws an exception like this, I don't know where the exception occurred.
In Visual Studio, it will tell you that the unhandled exception in which file, which function and which line, and when you look at that line, there is a big red cross after that code, so I can handle that easily.
However, in Qt, I have to make a breakpoint at the beginning of the main function and trace down the code line by line until I find where the exception is thrown. God, that's so annoying and time-wasting.
So I'm here asking is there a way to open stack trace in Qt? Like the stack trace in Visual Studio and the backtrace in gdb(open by typing bt or backtrace).
Hi @PikaCat,
if you run the program in the debugger, it will stop at the exception and show you the stack trace. If not, something is wrongly set up and you need to provide more info about your environment and setup.
Regards
-
#include<bits/stdc++.h>
void badFunction(){
    throw std::out_of_range("");
}
int main(){
    badFunction();
    return 0;
}
Just like the code above. When I use debug mode to run the code, it will terminate immediately and leave only a message of terminate called after throwing out_of_range.
Imagine this is a big project with hundreds and thousands of functions in it. When it throws an exception like this, I don't know where the exception occurred.
In Visual Studio, it will tell you that the unhandled exception in which file, which function and which line, and when you look at that line, there is a big red cross after that code, so I can handle that easily.
However, in Qt, I have to make a breakpoint at the beginning of the main function and trace down the code line by line until I find where the exception is thrown. God, that's so annoying and time-wasting.
So I'm here asking is there a way to open stack trace in Qt? Like the stack trace in Visual Studio and the backtrace in gdb(open by typing bt or backtrace).
@PikaCat
I presume you mean in Qt Creator. I'm not a regular user so I can't give you the exact instruction, but that has a debugger interface and includes a stack trace, just like e.g. Visual Studio. (If you're doinggcccompilation then Qt debugging just sits atopgdb). So just make sure you have your compiler/debugger set up in Qt Creator, set your program off for debugging, and you'll get the backtrace in some window. -
Hi
Try
https://stackoverflow.com/questions/16735413/how-can-i-make-qtcreator-break-on-exceptions
( add new breakpint, dont matter where, set to Break on c++ exception )
Then it shows the origin of the trow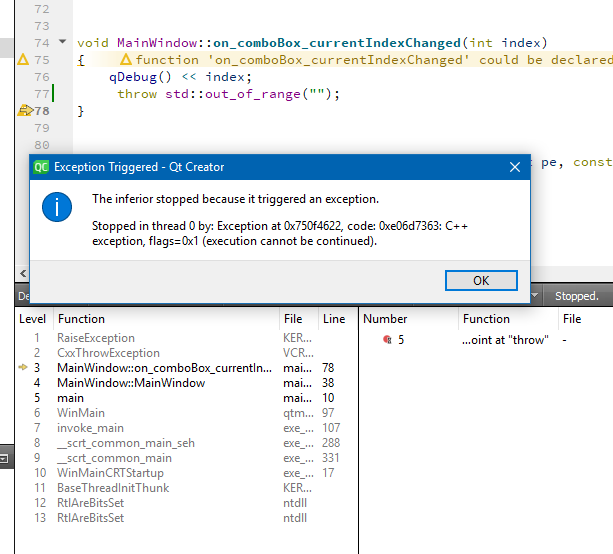
-
Hi @PikaCat,
if you run the program in the debugger, it will stop at the exception and show you the stack trace. If not, something is wrongly set up and you need to provide more info about your environment and setup.
Regards
@aha_1980
I'm using Qt Creator with default minGW7.3.0 64bit on Windows 10 1909. When I run the program above in debug mode it will just run normally and output a message(terminate ...) on the black console window. Then nothing shows up in the debugger window. -
Hi @PikaCat,
if you run the program in the debugger, it will stop at the exception and show you the stack trace. If not, something is wrongly set up and you need to provide more info about your environment and setup.
Regards
-
Hi
Try
https://stackoverflow.com/questions/16735413/how-can-i-make-qtcreator-break-on-exceptions
( add new breakpint, dont matter where, set to Break on c++ exception )
Then it shows the origin of the trow -
@mrjj After adding the breakpoint, it will stop at the exception throw line, but there are no windows like this saying "Exception Triggered".
Besides, the project I create is from Non-Qt Project -> Plain C++ application. -
@mrjj It's just like the program exits normally with the return value of 0. The debugger thinks that the program has already exited so it stopped showing things too. If you break on that line it stops but when you press F10, it will immediately stop execution the program.
-
@mrjj I think maybe the MSVC compiler has that function but minGW doesn't. So you can see that window pops out but I can't. But minGW's debugger is gdb, you can type bt in gdb and you can see the things you need. So accordingly, even if I'm using minGW, I should still have that function like gdb does.
-
@mrjj Moreover, if I add breakpoints at "Break when C++ exception is thrown", Whenever my program throws an exception. It will stop there, even if I had already caught it in the catch statement and solved it. The thing I want is the "UNHANDLED EXCEPTION". When the program doesn't handle the exception properly and cause the program to call std:: terminate() to terminate the program. QT debugger will stop there for me to see the stack trace and where the exception is thrown.
-
I find the solution to my problem. You can go to GDB Extended to check "the stop when abort() is called". Then it will stop at the line in which you throw an exception. But the problem is that there are no windows saying "Exception Triggered". That's very strange.
-
I find the solution to my problem. You can go to GDB Extended to check "the stop when abort() is called". Then it will stop at the line in which you throw an exception. But the problem is that there are no windows saying "Exception Triggered". That's very strange.
@PikaCat said in How to open stack trace in QT?:
But the problem is that there are no windows saying "Exception Triggered". That's very strange.
Is that a big problem? If the debugger stops at a throw, you should already know what happens.
You can go to GDB Extended to check "the stop when abort() is called".
Glad you found it and thanks for sharing!
Regards
