
Qt Graphs. Building 2d plot using c++ only.
-
You can even do it without a .qml file in 6.9 by using the
QQuickWidget::setInitialPropertiesandQQuickWidget::loadFromModule:QPieSeries* pieSeries = new QPieSeries(&app); // populate it QQuickWidget* graphsView = new QQuickWidget(); graphsView->setResizeMode(QQuickWidget::SizeRootObjectToView); graphsView->setInitialProperties({{"seriesList", QVariant::fromValue(pieSeries)}}); graphsView->loadFromModule("QtGraphs", "GraphsView");@GrecKo said in Qt Graphs. Building 2d plot using c++ only.:
You can even do it without a .qml file in 6.9 by using the
QQuickWidget::setInitialPropertiesandQQuickWidget::loadFromModule:QPieSeries* pieSeries = new QPieSeries(&app); // populate it QQuickWidget* graphsView = new QQuickWidget(); graphsView->setResizeMode(QQuickWidget::SizeRootObjectToView); graphsView->setInitialProperties({{"seriesList", QVariant::fromValue(pieSeries)}}); graphsView->loadFromModule("QtGraphs", "GraphsView");Amazing! How to create a line serial that using DATETIME as X and double as Y in C++ follow this example ?
For example, a 3-days weather forcast line graph , 2 hours / point ?
Thank you!
-
 J JonB referenced this topic
-
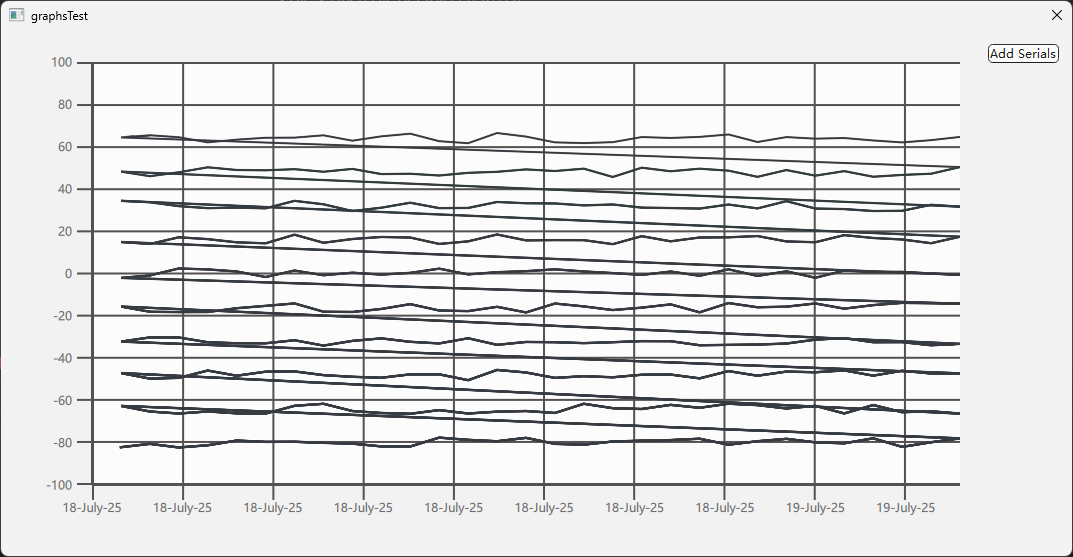
In response to the above requirements, I have written a small testing program. 10 curves can be refreshed correctly, but colors cannot be set independently, and there are extra connecting lines between the curves. Can someone help me identify where I went wrong? thank!
pro file
QT       += core gui widgets quickwidgets graphs quick

CONFIG += c++17

SOURCES += \
    main.cpp \
    graphstest.cpp

HEADERS += \
    graphstest.h

FORMS += \
    graphstest.ui
graphstest.h
#ifndef GRAPHSTEST_H
#define GRAPHSTEST_H
#include <QDateTimeAxis>
#include <QDialog>
#include <QLineSeries>
#include <QValueAxis>
#include <QVector>
QT_BEGIN_NAMESPACE
namespace Ui
{
class graphsTest;
}
QT_END_NAMESPACE

class graphsTest : public QDialog
{
	Q_OBJECT
public:
	graphsTest(QWidget *parent = nullptr);
	~graphsTest();
protected:
	void timerEvent(QTimerEvent *evt) override;
private slots:
	void on_pushButton_ok_clicked();
private:
	Ui::graphsTest *ui;
	QDateTimeAxis *m_ax;
	QValueAxis *m_ay;
	int m_timerEvent;
	QVector<QLineSeries *> m_lineSeries;
};
#endif // GRAPHSTEST_H
graphstest.cpp
#include "graphstest.h"
#include <QDateTime>
#include <QDebug>
#include <QQuickItem>
#include "ui_graphstest.h"
graphsTest::graphsTest(QWidget *parent)
	: QDialog(parent)
	, ui(new Ui::graphsTest)
	, m_ax(new QDateTimeAxis(this))
	, m_ay(new QValueAxis(this))
	, m_timerEvent(0)
{
	ui->setupUi(this);
	QDateTime dtmNow = QDateTime::currentDateTime();
	m_ax->setMin(dtmNow.addDays(-1));
	m_ax->setMax(dtmNow);
	m_ay->setRange(-100, 100);

	QList<QObject *> seriesList;
	ui->graphsView->setResizeMode(QQuickWidget::SizeRootObjectToView);
	ui->graphsView->setInitialProperties({{"seriesList", QVariant::fromValue(seriesList)},
										  {"axisX", QVariant::fromValue(m_ax)},
										  {"axisY", QVariant::fromValue(m_ay)}});
	ui->graphsView->loadFromModule("QtGraphs", "GraphsView");
	m_timerEvent = startTimer(500);
}

graphsTest::~graphsTest()
{
	delete ui;
}

void graphsTest::timerEvent(QTimerEvent *evt)
{
	if (evt->timerId() == m_timerEvent)
	{
		QList<QPointF> data;
		QDateTime dtmNow = QDateTime::currentDateTime();
		const int N = m_lineSeries.size();
		for (int n = 0; n < N; ++n)
		{
			for (int i = 0; i < 30; ++i)
			{
				data << QPointF(dtmNow.addSecs(-3600 * 24.0 / 30 * (29 - i)).toMSecsSinceEpoch(),
								(rand() % 500 - 250) / 100.0 + n * 16 - 80);
			}
			m_lineSeries[n]->replace(data);
		}
		m_ax->setMin(dtmNow.addDays(-1));
		m_ax->setMax(dtmNow);
	}
}

void graphsTest::on_pushButton_ok_clicked()
{
	if (m_lineSeries.size() >= 10)
		return;
	//Prepare new data
	QLineSeries *newLine = new QLineSeries(this);
	newLine->setColor(QColor(rand() % 128, rand() % 128, rand() % 128));
	//Add to Graph
	QVariant seriesListVariant = ui->graphsView->rootObject()->property("seriesList");
	if (seriesListVariant.canConvert<QQmlListProperty<QObject>>())
	{
		QQmlListProperty<QObject> prop = seriesListVariant.value<QQmlListProperty<QObject>>();
		prop.append(&prop, newLine);
		m_lineSeries.append(newLine);
	}
}
graphstest.ui
<?xml version="1.0" encoding="UTF-8"?>
<ui version="4.0">
 <class>graphsTest</class>
 <widget class="QDialog" name="graphsTest">
  <property name="geometry">
   <rect>
    <x>0</x>
    <y>0</y>
    <width>579</width>
    <height>332</height>
   </rect>
  </property>
  <property name="windowTitle">
   <string>graphsTest</string>
  </property>
  <layout class="QHBoxLayout" name="horizontalLayout">
   <item>
    <widget class="QQuickWidget" name="graphsView">
     <property name="resizeMode">
      <enum>QQuickWidget::ResizeMode::SizeRootObjectToView</enum>
     </property>
    </widget>
   </item>
   <item>
    <layout class="QVBoxLayout" name="verticalLayout">
     <property name="sizeConstraint">
      <enum>QLayout::SizeConstraint::SetMaximumSize</enum>
     </property>
     <item>
      <widget class="QPushButton" name="pushButton_ok">
       <property name="sizePolicy">
        <sizepolicy hsizetype="Fixed" vsizetype="Fixed">
         <horstretch>0</horstretch>
         <verstretch>0</verstretch>
        </sizepolicy>
       </property>
       <property name="text">
        <string>Add Serials</string>
       </property>
      </widget>
     </item>
     <item>
      <spacer name="verticalSpacer">
       <property name="sizePolicy">
        <sizepolicy hsizetype="Fixed" vsizetype="Expanding">
         <horstretch>0</horstretch>
         <verstretch>0</verstretch>
        </sizepolicy>
       </property>
       <property name="orientation">
        <enum>Qt::Orientation::Vertical</enum>
       </property>
       <property name="sizeHint" stdset="0">
        <size>
         <width>20</width>
         <height>40</height>
        </size>
       </property>
      </spacer>
     </item>
    </layout>
   </item>
  </layout>
 </widget>
 <customwidgets>
  <customwidget>
   <class>QQuickWidget</class>
   <extends>QWidget</extends>
   <header location="global">QtQuickWidgets/QQuickWidget</header>
  </customwidget>
 </customwidgets>
 <resources/>
 <connections/>
</ui>
main.cpp
#include "graphstest.h"
#include <QApplication>
int main(int argc, char *argv[])
{
	QApplication a(argc, argv);
	graphsTest w;
	w.show();
	return a.exec();
}
Qt 6.9.1 Mingw64 in windows 11:
Further more, how to add a rubber-band selection tool and connect QML signals to the C++ slots, is a bit hard for me . I'll try it later.
Qt is the best C++ framework I've ever met.
-
B BugSleeper referenced this topic
-
In response to the above requirements, I have written a small testing program. 10 curves can be refreshed correctly, but colors cannot be set independently, and there are extra connecting lines between the curves. Can someone help me identify where I went wrong? thank!
pro file
QT       += core gui widgets quickwidgets graphs quick

CONFIG += c++17

SOURCES += \
    main.cpp \
    graphstest.cpp

HEADERS += \
    graphstest.h

FORMS += \
    graphstest.ui
graphstest.h
#ifndef GRAPHSTEST_H
#define GRAPHSTEST_H
#include <QDateTimeAxis>
#include <QDialog>
#include <QLineSeries>
#include <QValueAxis>
#include <QVector>
QT_BEGIN_NAMESPACE
namespace Ui
{
class graphsTest;
}
QT_END_NAMESPACE

class graphsTest : public QDialog
{
	Q_OBJECT
public:
	graphsTest(QWidget *parent = nullptr);
	~graphsTest();
protected:
	void timerEvent(QTimerEvent *evt) override;
private slots:
	void on_pushButton_ok_clicked();
private:
	Ui::graphsTest *ui;
	QDateTimeAxis *m_ax;
	QValueAxis *m_ay;
	int m_timerEvent;
	QVector<QLineSeries *> m_lineSeries;
};
#endif // GRAPHSTEST_H
graphstest.cpp
#include "graphstest.h"
#include <QDateTime>
#include <QDebug>
#include <QQuickItem>
#include "ui_graphstest.h"
graphsTest::graphsTest(QWidget *parent)
	: QDialog(parent)
	, ui(new Ui::graphsTest)
	, m_ax(new QDateTimeAxis(this))
	, m_ay(new QValueAxis(this))
	, m_timerEvent(0)
{
	ui->setupUi(this);
	QDateTime dtmNow = QDateTime::currentDateTime();
	m_ax->setMin(dtmNow.addDays(-1));
	m_ax->setMax(dtmNow);
	m_ay->setRange(-100, 100);

	QList<QObject *> seriesList;
	ui->graphsView->setResizeMode(QQuickWidget::SizeRootObjectToView);
	ui->graphsView->setInitialProperties({{"seriesList", QVariant::fromValue(seriesList)},
										  {"axisX", QVariant::fromValue(m_ax)},
										  {"axisY", QVariant::fromValue(m_ay)}});
	ui->graphsView->loadFromModule("QtGraphs", "GraphsView");
	m_timerEvent = startTimer(500);
}

graphsTest::~graphsTest()
{
	delete ui;
}

void graphsTest::timerEvent(QTimerEvent *evt)
{
	if (evt->timerId() == m_timerEvent)
	{
		QList<QPointF> data;
		QDateTime dtmNow = QDateTime::currentDateTime();
		const int N = m_lineSeries.size();
		for (int n = 0; n < N; ++n)
		{
			for (int i = 0; i < 30; ++i)
			{
				data << QPointF(dtmNow.addSecs(-3600 * 24.0 / 30 * (29 - i)).toMSecsSinceEpoch(),
								(rand() % 500 - 250) / 100.0 + n * 16 - 80);
			}
			m_lineSeries[n]->replace(data);
		}
		m_ax->setMin(dtmNow.addDays(-1));
		m_ax->setMax(dtmNow);
	}
}

void graphsTest::on_pushButton_ok_clicked()
{
	if (m_lineSeries.size() >= 10)
		return;
	//Prepare new data
	QLineSeries *newLine = new QLineSeries(this);
	newLine->setColor(QColor(rand() % 128, rand() % 128, rand() % 128));
	//Add to Graph
	QVariant seriesListVariant = ui->graphsView->rootObject()->property("seriesList");
	if (seriesListVariant.canConvert<QQmlListProperty<QObject>>())
	{
		QQmlListProperty<QObject> prop = seriesListVariant.value<QQmlListProperty<QObject>>();
		prop.append(&prop, newLine);
		m_lineSeries.append(newLine);
	}
}
graphstest.ui
<?xml version="1.0" encoding="UTF-8"?>
<ui version="4.0">
 <class>graphsTest</class>
 <widget class="QDialog" name="graphsTest">
  <property name="geometry">
   <rect>
    <x>0</x>
    <y>0</y>
    <width>579</width>
    <height>332</height>
   </rect>
  </property>
  <property name="windowTitle">
   <string>graphsTest</string>
  </property>
  <layout class="QHBoxLayout" name="horizontalLayout">
   <item>
    <widget class="QQuickWidget" name="graphsView">
     <property name="resizeMode">
      <enum>QQuickWidget::ResizeMode::SizeRootObjectToView</enum>
     </property>
    </widget>
   </item>
   <item>
    <layout class="QVBoxLayout" name="verticalLayout">
     <property name="sizeConstraint">
      <enum>QLayout::SizeConstraint::SetMaximumSize</enum>
     </property>
     <item>
      <widget class="QPushButton" name="pushButton_ok">
       <property name="sizePolicy">
        <sizepolicy hsizetype="Fixed" vsizetype="Fixed">
         <horstretch>0</horstretch>
         <verstretch>0</verstretch>
        </sizepolicy>
       </property>
       <property name="text">
        <string>Add Serials</string>
       </property>
      </widget>
     </item>
     <item>
      <spacer name="verticalSpacer">
       <property name="sizePolicy">
        <sizepolicy hsizetype="Fixed" vsizetype="Expanding">
         <horstretch>0</horstretch>
         <verstretch>0</verstretch>
        </sizepolicy>
       </property>
       <property name="orientation">
        <enum>Qt::Orientation::Vertical</enum>
       </property>
       <property name="sizeHint" stdset="0">
        <size>
         <width>20</width>
         <height>40</height>
        </size>
       </property>
      </spacer>
     </item>
    </layout>
   </item>
  </layout>
 </widget>
 <customwidgets>
  <customwidget>
   <class>QQuickWidget</class>
   <extends>QWidget</extends>
   <header location="global">QtQuickWidgets/QQuickWidget</header>
  </customwidget>
 </customwidgets>
 <resources/>
 <connections/>
</ui>
main.cpp
#include "graphstest.h"
#include <QApplication>
int main(int argc, char *argv[])
{
	QApplication a(argc, argv);
	graphsTest w;
	w.show();
	return a.exec();
}
Qt 6.9.1 Mingw64 in windows 11:
Further more, how to add a rubber-band selection tool and connect QML signals to the C++ slots, is a bit hard for me . I'll try it later.
@goldenhawking You failed to clear QList<QPointF> data; at each time a new line is perpared!
if (evt->timerId() == m_timerEvent) { QDateTime dtmNow = QDateTime::currentDateTime(); const int N = m_lineSeries.size(); for (int n = 0; n < N; ++n) { QList<QPointF> data; //Here for (int i = 0; i < 30; ++i) { data << QPointF(dtmNow.addSecs(-3600 * 24.0 / 30 * (29 - i)).toMSecsSinceEpoch(), (rand() % 500 - 250) / 100.0 + n * 16 - 80); } m_lineSeries[n]->replace(data); } //... -
@goldenhawking You failed to clear QList<QPointF> data; at each time a new line is perpared!
if (evt->timerId() == m_timerEvent) { QDateTime dtmNow = QDateTime::currentDateTime(); const int N = m_lineSeries.size(); for (int n = 0; n < N; ++n) { QList<QPointF> data; //Here for (int i = 0; i < 30; ++i) { data << QPointF(dtmNow.addSecs(-3600 * 24.0 / 30 * (29 - i)).toMSecsSinceEpoch(), (rand() % 500 - 250) / 100.0 + n * 16 - 80); } m_lineSeries[n]->replace(data); } //...@BugSleeper said in Qt Graphs. Building 2d plot using c++ only.:
So you're talking to yourself now? Why two accounts?
Qt Online Installer direct download: https://download.qt.io/official_releases/online_installers/
Visit the Qt Academy at https://academy.qt.io/catalog -
@BugSleeper said in Qt Graphs. Building 2d plot using c++ only.:
So you're talking to yourself now? Why two accounts?
@Christian-Ehrlicher said in Qt Graphs. Building 2d plot using c++ only.:
ing to yourself now? Why two accounts?
I'm GH's student, We're using a same computer!
-
@Christian-Ehrlicher said in Qt Graphs. Building 2d plot using c++ only.:
ing to yourself now? Why two accounts?
I'm GH's student, We're using a same computer!
@BugSleeper said in Qt Graphs. Building 2d plot using c++ only.:
I'm GH's student, We're using a same computer!
This explains it. Thx.
We have a lot of really interesting spam in the last weeks so this was somewhat suspicious.