
Qt 6.12 LTS is out! See what's new in the release
blog
Get QLineSeries to also show the data points?
-
When I run my code I get:
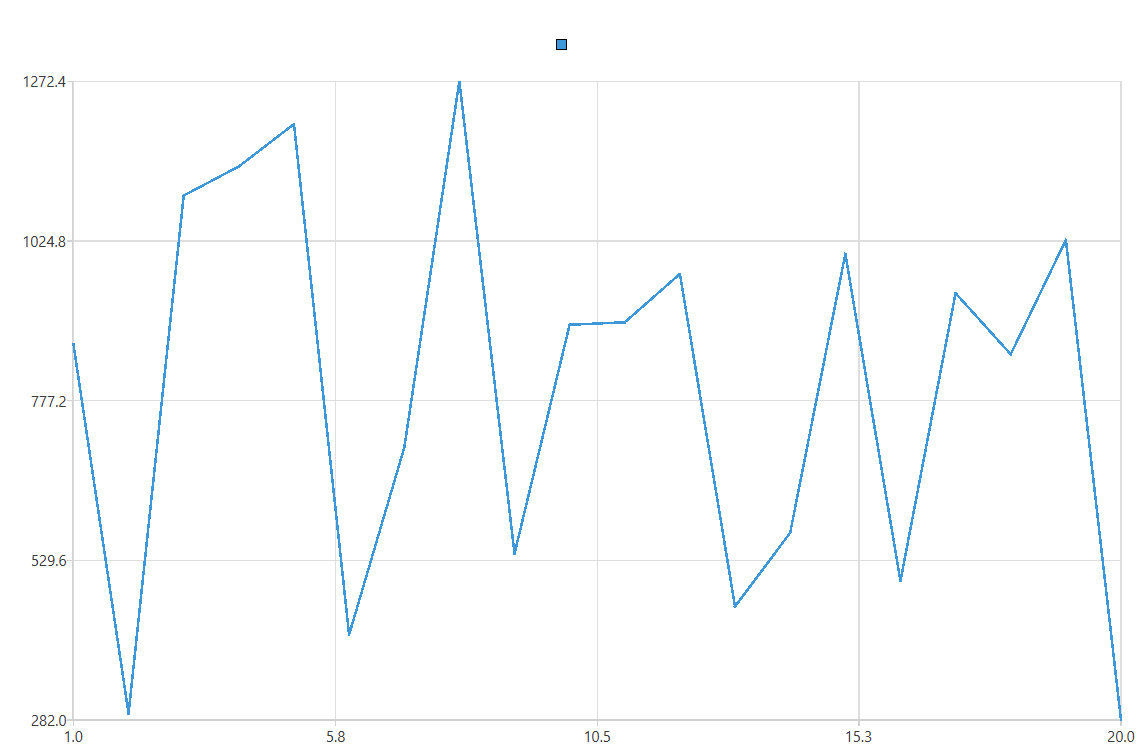
- How to get each data point to be marked with e.g. a blob?
- What's that blue blob at the top.
How to get each data point to be marked with e.g. a blob?
I would guess https://doc.qt.io/qt-6/qxyseries.html#setPointConfiguration ?
What's that blue blob at the top.
The "legend" or whatever they call it for the blue line, which you have left empty/unnamed, see https://doc.qt.io/qt-6/qabstractseries.html#name-prop?

