Unsolved How to bring PyQt axis or ticks to the front?
-
As you can see if you run the code or look at the image below, the ticks of the PyQt axis is missing. Does anyone know how to show the axis ticks?
import numpy as np
from pyqtgraph.Qt import QtCore, QtGui
import pyqtgraph as pgapp = QtGui.QApplication([])
plot = pg.PlotItem()
plot.setLabel(axis='left', text='Y-axis')
plot.setLabel(axis='bottom', text='X-axis')imv = pg.ImageView(view=plot) # set the plot to ImageView's view
view = plot.getViewBox()
view.setLimits(xMin = 0, xMax = 500, yMin = 0, yMax = 500)
plot.getAxis('left').()data = np.fromfunction(lambda i, j: np.sin(i/16)*j/128, (512, 512), dtype=float) + np.random.normal(scale=0.2, size=(512, 512))
imv.setImage(data)vbox = imv.getView()
vbox.addItem(pg.LabelItem("this is a nice label"))imv.show()
app.exec_()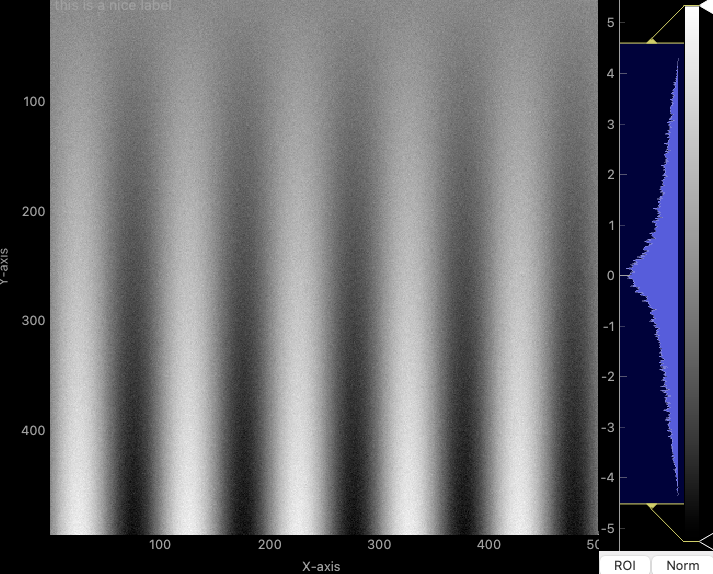
-
Hi and welcome to devnet,
This looks like a pyqtgraph issue. You should check with its authors.