Solved QTCharts: use of tooltips
-
Hello everybody.
I'm doing a page with graphics in QML, which is loaded dynamically by calling an api, which gives a JSON response, which then fills the graphics.
This part works, and I use as AXis X, a DateTimeAxis, and as Y a simple ValueAxis.
I have a situation like this:
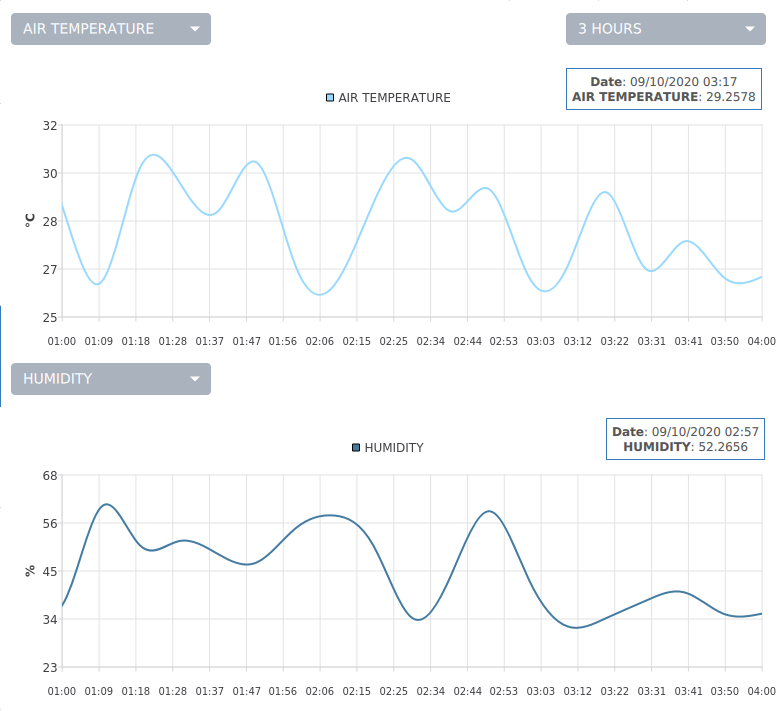
The problem concerns the tooltips: when I open the graph I show the date and value of the last value of the graph and this thing works, but the problem is that when I click on a point of the graph, it is not necessarily a real point of the graph. I'll explain. If I have a line that goes from 26.4 to 25.3 I can click somewhere in the middle, and then it goes to show me a 26.1345 for example. First of all, therefore, I would like to be able to click only the real points drawn on the graph (perhaps also showing points on the clickable values). Another problem: if I change the view the tooltip disappears, instead I would like it to always remain visible, initially with the last value of the graph. Even the datetime it shows me in the axis isn't quite consistent with what I have in the JSON. In the JSON I have 10 minute intervals, for example: 01:00, 01:10, 01:20, etc and on the graph I have slightly different values.
In the meantime I wrote the question, let me know if these things are feasible and possibly tell me what part of the code you need.
If it were better to opt for C ++, I state that I have no experience, and if you know how to help me I also accept this solution, however it must connect with qml anyway, because it is a QML project, with a single page, but has a stackview on several pages arranged on a tab, and the graphs is one of the tabs arranged on this stackView.
Thanks for now.
Regards