Unsolved Detecting peak value on realtime data stream
-
Hi all,
This is a bit off topic question! but hope I get some feedback from this forum.
I'm using QCustomPlot to display realtime value from an IMU.
This is how I set the
realtimeDataSlot:void Settings::realtimeDataSlot(double x_acceleration_g, double y_acceleration_g, double z_acceleration_g, double z_acceleration_gnew) { static QTime time(QTime::currentTime()); // calculate two new data points: double key = time.elapsed()/1000.0; // time elapsed since start of demo, in seconds static double lastPointKey = 0; if (key-lastPointKey > 0.02) // at most add point every 20 ms { // add data to lines: ui->customPlot->graph(0)->addData(key, x_acceleration_g); // X axis ui->customPlot->graph(1)->addData(key, y_acceleration_g); // Y axis ui->customPlot->graph(2)->addData(key, z_acceleration_g); // Z axis ui->customPlot->graph(3)->addData(key, z_acceleration_gnew); lastPointKey = key; } // make key axis range scroll with the data (at a constant range size of 8): ui->customPlot->xAxis->setRange(key, 8, Qt::AlignRight); ui->customPlot->replot(); // calculate frames per second: static double lastFpsKey; static int frameCount; ++frameCount; if (key-lastFpsKey >2) // average fps over 2 seconds { ui->statusbar->showMessage( QString("%1 FPS, Total Data points: %2") .arg(frameCount/(key-lastFpsKey), 0, 'f', 0) .arg(ui->customPlot->graph(0)->data()->size()+ui->customPlot->graph(1)->data()->size()) , 0); lastFpsKey = key; frameCount = 0; } }which shows me as follows:
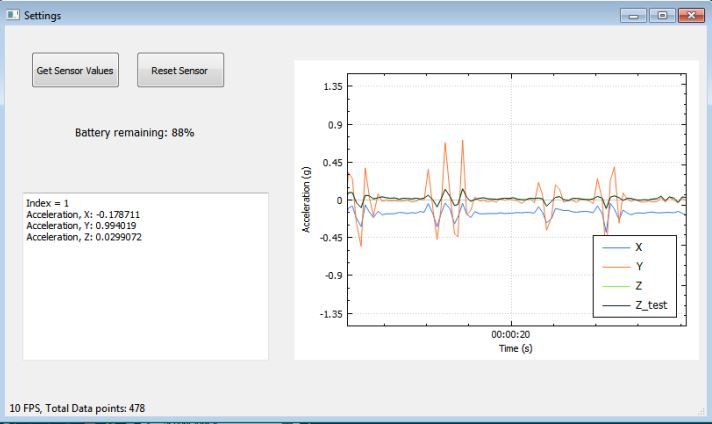
As a next step, I need to detect the peaks (I define peak as that value (positive values) more than 0.25 g at high rate.) in any axis, say for example in the above figure in the Y axis there are peak values which I need to detect and count. Can somebody show me a way to do this?
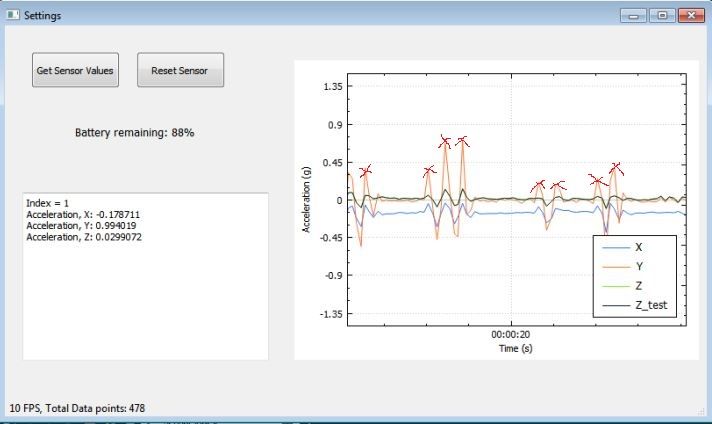
I need to mark peaks as follows:
-
@viniltc said in Detecting peak value on realtime data stream:
I need to detect the peaks (I define peak as that value (positive values) more than 0.25 g at high rate.) in any axis, say for example in the above figure in the Y axis there are peak values which I need to detect and count. Can somebody show me a way to do this?
"Peak detection" is quite a big field.
You can start by reading up on peak detection algorithms, or using a peak detection library in your application: https://www.google.com/search?q=peak+detection+library+c%2B%2B
-
Please inform readers if you cross-post to other forums: https://stackoverflow.com/questions/60543683/detecting-peak-value-on-realtime-data-stream
This is to make sure people don't spend time answering if you already found a solution.