Solved A QChart example
-
Hi people,
Please take a look at this Zoom Line Example.
In the code, the following is the real accountable part for drawing the curve, here a Sin one:QLineSeries *series = new QLineSeries(); for (int i = 0; i < 500; i++) { QPointF p((qreal) i, qSin(M_PI / 50 * i) * 100); *series << p; }And this is the output:
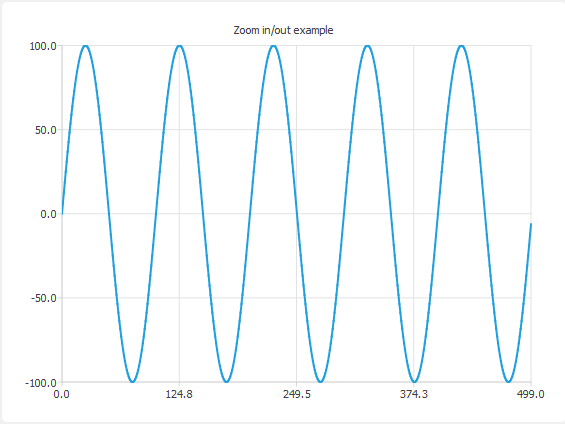
The X values are increasing from 0 to 499. And the Y values are fluctuating from -100 to +100. But the Sin formula above can't go negative! So how is the wave drawn this way, please?
-
@tomy
yes
"Returns the sine of the angle v in radians." -
Hi
qDebug dont agree with you :)for (int i = 0; i < 500; i++) { QPointF p((qreal) i, qSin(M_PI / 50 * i) * 100); qDebug() << p; }.....
QPointF(244,36.8125)
QPointF(245,30.9017)
QPointF(246,24.869)
QPointF(247,18.7381)
QPointF(248,12.5333)
QPointF(249,6.27905)
QPointF(250,-1.16403e-13)
QPointF(251,-6.27905)
QPointF(252,-12.5333)
QPointF(253,-18.7381)
QPointF(254,-24.869)
QPointF(255,-30.9017) -
@mrjj
thanks mrjj. :)for i = 251 let's check the value of y:
QPointF p((qreal) 251, qSin(M_PI / 50 * 251) * 100) =
QPointF p(251, qSin(3.14 / 50 * 251) * 100) =
QPointF p(251, qSin(15.76) * 100) =
QPointF p(251, 0.271 * 100) =
QPointF p(251, 27.1) -
Hi
for (int i = 251; i < 255; i++) {
QPointF p((qreal) i, qSin(M_PI / 50 * i) * 100);
qDebug() << p;
}gives
QPointF(251,-6.27905)
QPointF(252,-12.5333)
QPointF(253,-18.7381)
QPointF(254,-24.869)so something is up :)
-
@mrjj
Hi. :)But why when I manually calculate i =251, it gives me 27.1 and not -6.27905 for y!?
Isn't M_PI = 3.14?
Or the y coordinates are modified by some other part of the whole code? No, I think. Rather odd. -
Hi
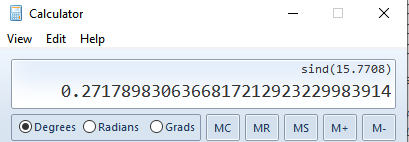
well its (3.14159265358979323846)
(3.14159265358979323846 / 50 * 251) = 15.7708
qSin(15.7708) * 100; = -6.27954 -
-
@tomy
yes
"Returns the sine of the angle v in radians."